Softball spent the last decade walking away from the sacrifice bunt, and it was right to. We can now say exactly how right, because we rebuilt the run expectancy table for the entire 2026 Division I season and checked the trade directly. Giving away an out to move a runner from first and second costs 0.216 runs every time it works.
But run expectancy is average runs, and average runs is not what a coach is buying in a tie game in the sixth. She is buying the chance of scoring at all, which is a different number. So we built that one too, and on that yardstick the sacrifice stops looking like a blanket mistake. A successful bunt from first and second with nobody out actually raises the chance of scoring, by two percentage points.
Then we looked at what actually happens when teams try it.
Share that produced second and third with one out: 17%.
Chance of scoring after the attempt: .623. After just letting her hit: .701.
The theoretical case survives the better yardstick. Execution does not. Four out of five attempts do something other than the intended thing, and the attempt as a whole costs almost eight points of scoring probability. The fear driving the play is overstated too: swinging away from that same spot produced a double play just 2.0% of the time across 8,630 chances.
The sport quit the wrong bunt
Here is the part worth putting on a whiteboard. Bunting to give up an out and bunting for a hit are different strategies that share a word, and the data pulls them in opposite directions.
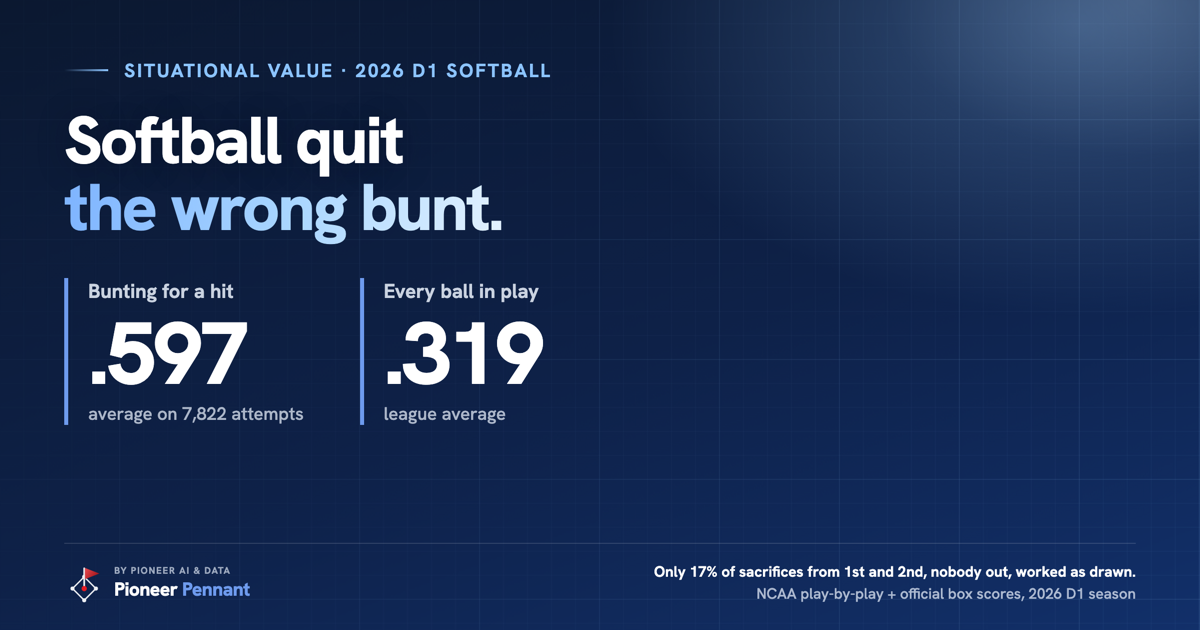
League average on all balls in play: .319.
In run terms a bunt-for-hit attempt is worth +0.177 runs more than an ordinary plate appearance from the same base-out situation. That is the shape of a real inefficiency. Defenses set up for a league that swings for extra bases, corners play back, and the ground in front of them goes unclaimed.
The honest caveat is that this is a conditional edge. Hitters bunt for a hit when they are fast and the corners are deep, so the .597 reflects good spot-picking as much as the tactic itself, and it would not survive being used indiscriminately. But at 7,822 attempts against 6,449 sacrifices, the productive version is being used barely more often than the one that costs runs, by teams that already know how to do it.
While we are handing out corrections
Steals need more than most programs think. Taking second with nobody out needs a 71% success rate to break even. Taking third needs up to 86%, because a runner on second is already in scoring position and there is far less to gain. Most of the country runs at rates that lose runs on net.
And the run values everything above depends on are measured on softball, not borrowed from baseball. In this run environment a home run is worth 1.82 wOBA points against baseball's 2.01, while a walk climbs to 0.79 from 0.69. Seven innings and a hot scoring environment compress the extremes and make getting on base relatively more valuable.
How we got here, including the parts we got wrong
None of this was possible in June. Base-out state, meaning who is on which base with how many out, existed for only 620 games in our data, which capped every situational question at eight percent of the season. The NCAA text spells out every runner movement, so we replayed all 618,310 play-by-play rows through a state machine and rebuilt it.
Then we checked it, which is the part that matters. Those 620 charted games carry the same state recorded independently, so they became a test set. Base state matches 90.7% of the time and outs 95.1%, across 21,450 plate appearances. Run expectancy now rests on 405,730 plate appearances instead of a televised sample.
Two things we tried did not work, and they are on the page as failures. A Gaussian mixture was supposed to discover natural offensive archetypes and found none, because offensive style in this sport is a continuum rather than a set of camps. A gradient-boosted win probability model beat the lookup table it was meant to replace by 1.6%, which is real but modest, and only after we caught ourselves grading the old model on data it had already seen.
We also audited our own published work and found errors in it. Our earlier finding that putaway rate is "close to a constant" across two-strike counts was backwards, caused by dividing strikeouts by pitches instead of by plate appearances. Measured properly it runs from 35.4% at 0-2 down to 18.5% at 3-2. A batted-ball table we published listed feed labels as if they were outcomes. Both are corrected, with the correction stated on the page rather than quietly swapped.
The full season, the rankings, every team's national and conference standing, and the glossary that explains all of it in plain language before it explains it technically, are at the 2026 sabermetric season.
Method, briefly: base-out state reconstructed from free public play-by-play for all 7,933 completed games and validated against independently charted games at 90.7% exact. Run values fit on this season rather than imported. Every number in this post is re-checked by code against the dataset before the page builds. When a number here and the data disagree, the page refuses to publish.
Figuring out where your player fits in college?
Pioneer Pennant Process covers all 978 NCAA softball schools: coaches and how to reach them, cost after aid, majors, and a fit score built on one rule. Go where you are going to play, not as high as you can go.