Every travel tournament has the same conversation going on behind the backstop. One dad says his daughter is only looking at D1. Another parent says her daughter took a D2 offer and is starting as a freshman. Nobody in that conversation knows how many schools just got ruled out.
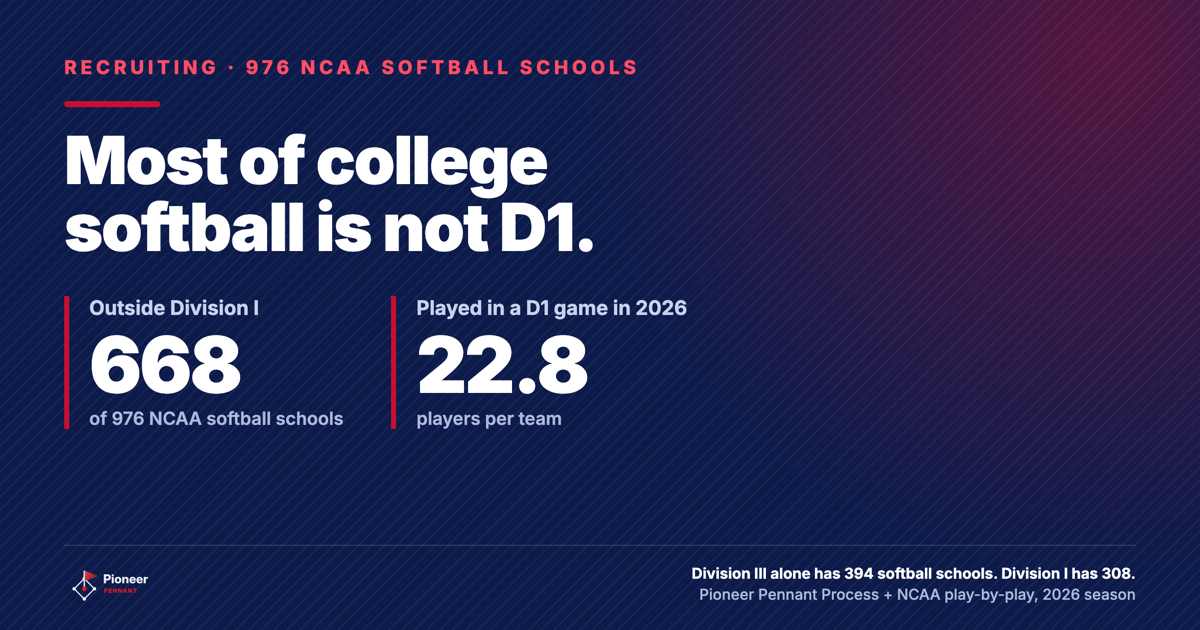
Here is the count. There are 976 NCAA softball schools in the database behind Pioneer Pennant Process, and 668 of them are not Division I. The D1 vs D2 vs D3 softball argument gets run like a ladder, with Division I on top and everything else below it. The 2026 Division I season and the published 2026 rosters at the other two levels point at a different question: not how high she can go, but where she will be on the field.
So I counted. School by school, roster by roster.
What actually separates D1, D2, and D3 softball
The divisions differ in how many schools are in them, how big those schools are, and what kind of aid they can offer. The NCAA adopted the three-division structure in 1973 to create a fair playing field for teams from similar schools. The structure was never a ranking of players. The figures below come from the NCAA's 2026-27 Guide for the College-Bound Student-Athlete, counting all sports, not just softball.
| Across all sports | D1 | D2 | D3 |
|---|---|---|---|
| Active schools | 361 | 296 | 416 |
| Median undergrad enrollment | 8,900 | 2,100 | 1,600 |
| Athletes per undergrad | 1 in 24 | 1 in 9 | 1 in 5 |
| Athletics scholarships | Yes | Partial only | None |
Division III is the largest of the three divisions by school count, and it is the one where a student is most likely to be an athlete. One undergraduate in five plays a sport at a Division III school. At a Division I school it is one in twenty four.
Size is the other thing. A median undergraduate enrollment of 8,900 at Division I against 1,600 at Division III is a different kind of campus before anybody picks up a bat.
Two out of three NCAA softball schools are not Division I
Of the 976 NCAA softball schools in Process, 668 play Division II or Division III. Division I has 308 softball schools, Division II has 274, and Division III has 394, more than either of the other two.
308 of them Division I.
668 of them not.
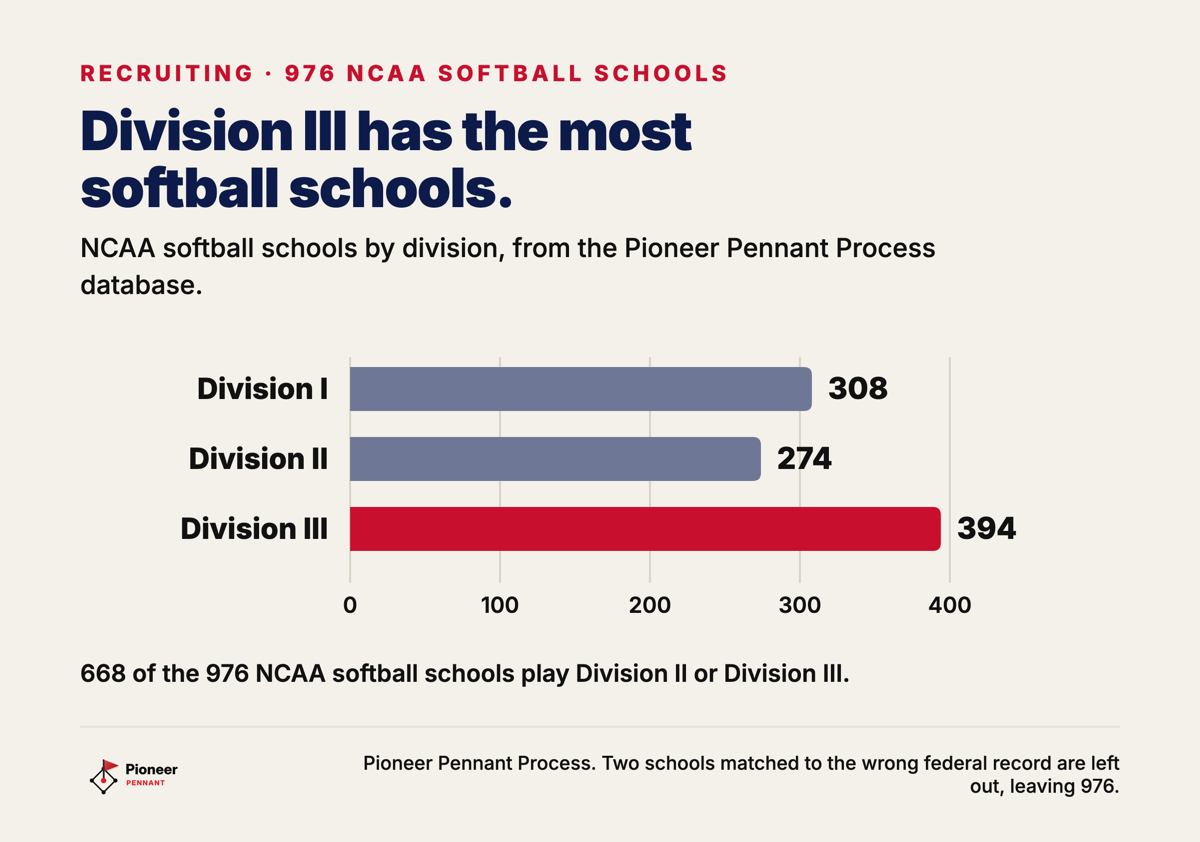
A family that has settled on Division I before the sophomore season has cut the list to under a third of the sport. That can be the right call. Cutting two thirds of the sport should be a decision somebody made on purpose, not the default that happens when nobody looks at every Division III softball school on the way past.
A larger share of high school players ends up in Division III than in Division I
Of high school softball players, 2.4% go on to compete in NCAA Division III, 2.0% in Division I, and 1.9% in Division II. The NCAA publishes those shares itself, and they do not line up with the ladder. The figures come from NCAA Research's Estimated Probability of Competing in College Athletics, last updated April 1, 2024, using 2022-23 participation counts.
The same table puts 344,952 players in high school softball and 21,646 in NCAA softball, which is 6.3% overall. The NCAA calculates each division's share by dividing that division's participants by all high school participants, which assumes high school and college rosters turn over at about the same rate.
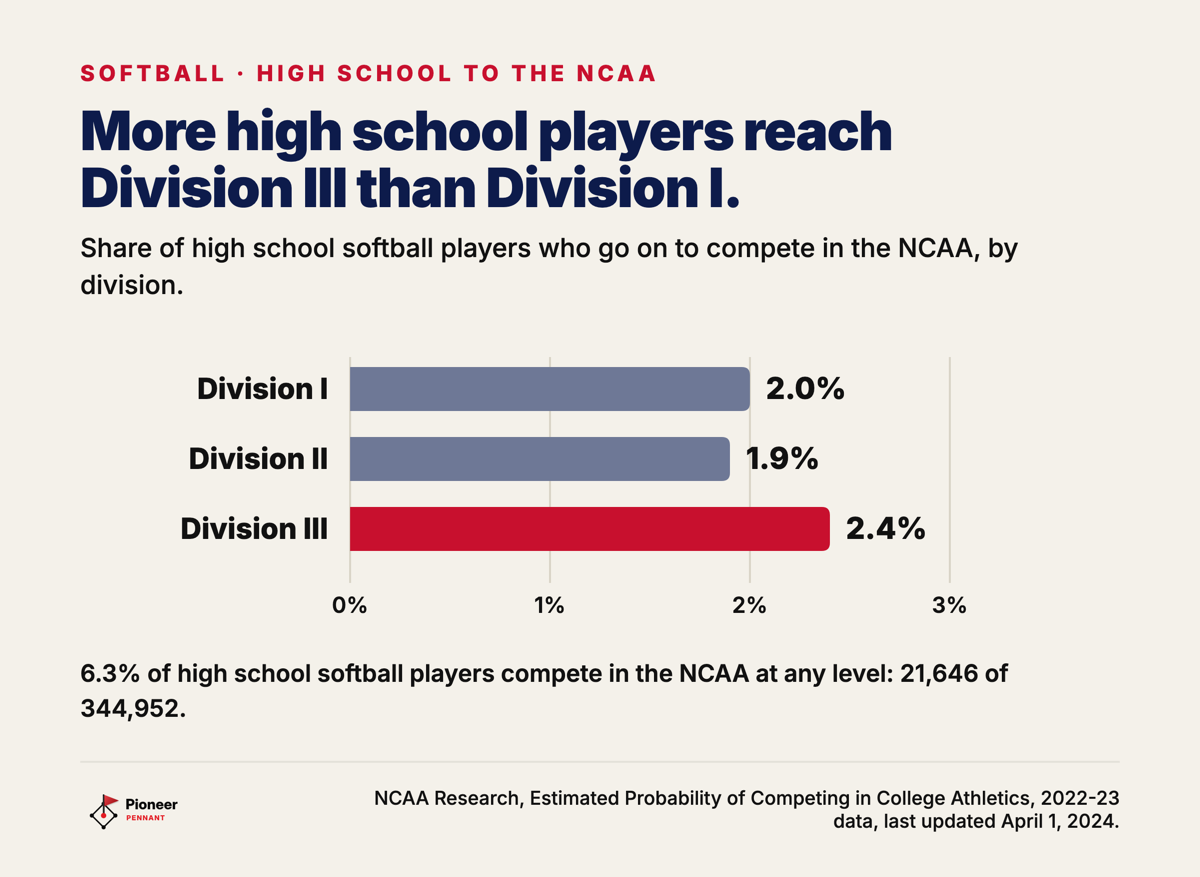
A division's share is a door, not a grade. The widest door out of high school softball is Division III, wider than the Division I door by about a fifth.
A Division I roster is capped at 25, and in 2026 nearly that many played
NCAA Bylaw 17.2 caps a Division I softball roster at 25 players. The cap applies to each sport of a Division I school that belongs to a defendant conference or opted in to the House settlement, the court-approved class-action settlement that replaced Division I scholarship limits with roster limits in 2025. Bylaw 17.2 was adopted June 6, 2025, took effect July 1, 2025, and was last revised August 25, 2026, per the NCAA's Legislative Services Database.
At those schools, sport-specific scholarship limits no longer apply at all. The NCAA Division I Board of Directors replaced the scholarship limits with roster limits effective July 1, 2025. Any softball scholarship count you read that was written before that summer describes a rule that has since changed for those programs.
Now the part nobody counts. In the 2026 Division I season, 6,989 players appeared in at least one game, across 307 of the 308 Division I teams. That is 22.8 players per team who got on the field.
The cap and the count cover slightly different sets of schools, so they do not divide into a tidy percentage. Side by side they still say something plain. A Division I team in 2026 was not nine starters and a long bench.
The depth holds up well past a single appearance. The median Division I player who appeared at all appeared in 32 games. Of the 6,989, 6,126 played in 10 or more games and 4,953 played in 20 or more, which is 70.9% of everyone who got on the field. 2,671 played in 40 or more.
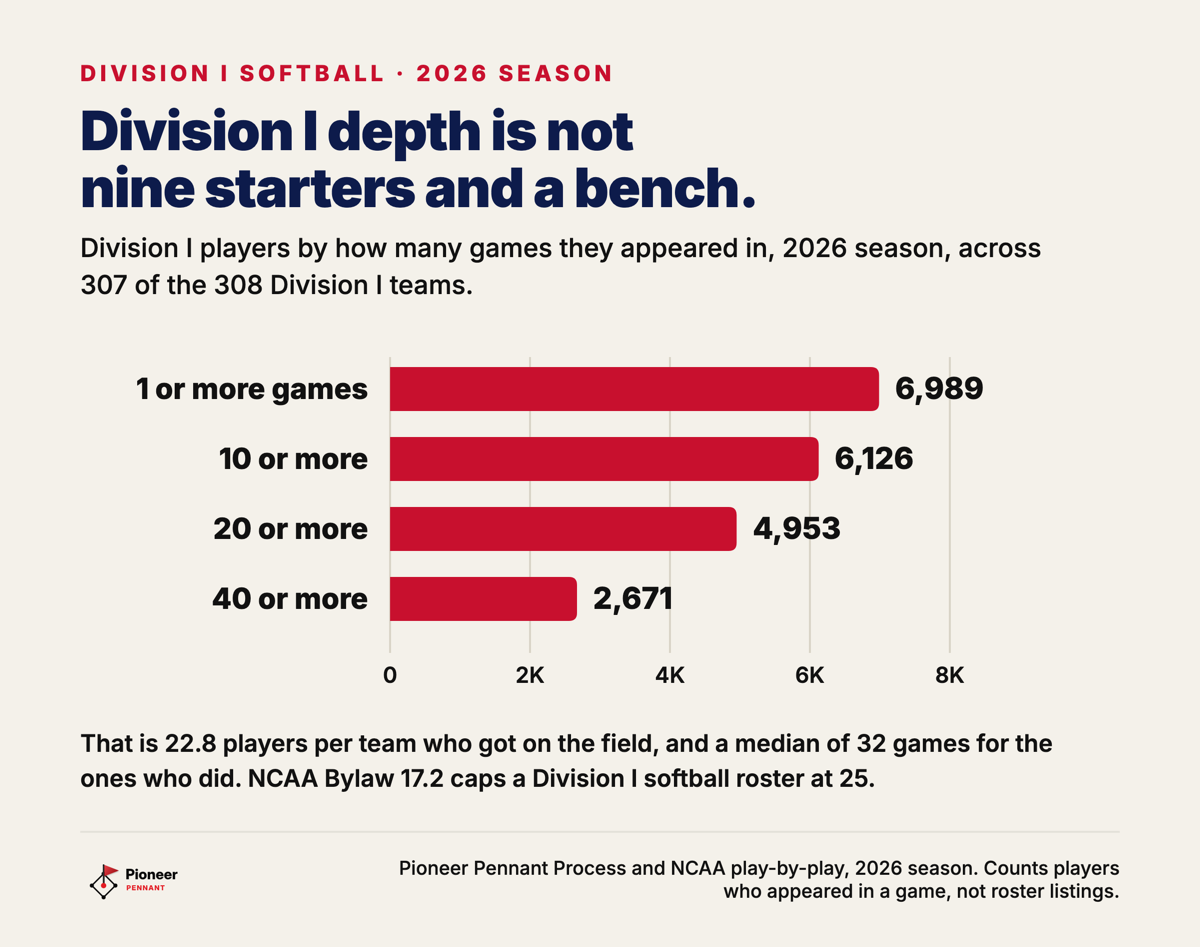
The claim that a Division I player sits until her junior year is on a lot of recruiting pages. The 2026 season does not look like that.
Division II and Division III rosters run about the same size
A roster spot is not smaller outside Division I. Across the 239 Division II schools whose published 2026 roster Process holds, 5,177 players are listed, an average of 21.7 per roster. Across the 303 Division III schools with a published 2026 roster, 6,322 players are listed, an average of 20.9. Put the two divisions together and the published 2026 roster averages 21.2 players.
| 2026 rosters | D1 | D2 | D3 |
|---|---|---|---|
| What we count | Played in a game | On the roster | On the roster |
| Schools covered | 307 of 308 | 239 of 274 | 303 of 394 |
| Players | 6,989 | 5,177 | 6,322 |
| Per team | 22.8 | 21.7 | 20.9 |
Those columns are not the same measurement, and the table says so on its first row. Division I rosters come to us through play-by-play, so a Division I player appears once she has been in a game. Division II and Division III rosters come from what each school publishes on its own athletics site. Comparing the 22.8 with the 21.7 as though both counted the same thing would be the same mistake as comparing a postseason team with the whole country.
Both measurements agree on the shape anyway. Roster spots do not get scarce as you go down the divisions. There are just more teams once you leave Division I.
What the money looks like in each division
Division I and Division II schools together hand out more than $4.3 billion in athletics aid a year to nearly 210,000 athletes across all sports, and Division III schools offer no athletics scholarships at all. In Division II, softball works on an equivalency model with a maximum of 7.2 scholarships spread across the entire team, per the NCAA's Division II athletics scholarship page. A coach divides those 7.2 among the roster, so a Division II offer is usually a piece of one, not a full ride.
Division III's zero is the number that misleads families the most. 80% of Division III athletes receive nonathletics aid, per the 2026-27 NCAA guide, and academic and need-based money at a small private school is often larger than a partial athletics award somewhere else. The bill at the end is what matters, and the bill is not what the sticker says. We ran the net price after aid for these schools in what college softball actually costs after aid.
How to pick the division that fits
Start from where your player will be on the field in year two, then work backward to the schools that fit academically and financially.
- Name the playing time you want, out loud. A family that would be unhappy with two years of spot appearances has just told you something about which division to target. There is no wrong answer here, but an unspoken one causes trouble in February of freshman year.
- Build the list at three levels at once. The same player is often a middle-of-the-roster Division I recruit and a day-one Division III starter. Process holds academics, majors, cost and coach contacts for all three levels, so the school search can hold all of them in one list.
- Check the roster before you check the record. A published roster with nine players in your daughter's position and two seniors in front of her tells you more about her freshman year than the team's win total does.
- Price the school, not the division. Division is a poor predictor of what you will pay. Public against private moves the number far more.
Go where she is going to play, not as high as she can go. That was the rule before I counted anything. The counting just agrees.
Method, briefly: school counts, roster listings and Division I appearance counts come from the Pioneer Pennant Process database, which carries all 978 NCAA softball schools. Two schools matched to the wrong federal record are left out of every count here, leaving 976. Division I appearance counts come from 2026 play-by-play and include every player who got into at least one game, so they are not roster listings. Division II and Division III roster counts are the rosters each school published on its own athletics site when Process last read it, which covers 239 of 274 Division II schools and 303 of 394 Division III schools. Division rules, participation figures and aid figures come from the NCAA's own pages and manuals, each linked where it is used. NAIA and junior college schools follow different governing bodies and are not covered. Every Process number in this post is re-checked by code against the database before the page builds, and when a number here and the data disagree, the page refuses to publish.
Figuring out where your player fits in college?
Pioneer Pennant Process covers all 978 NCAA softball schools: coaches and how to reach them, cost after aid, majors, and a fit score built on one rule. Go where you are going to play, not as high as you can go.