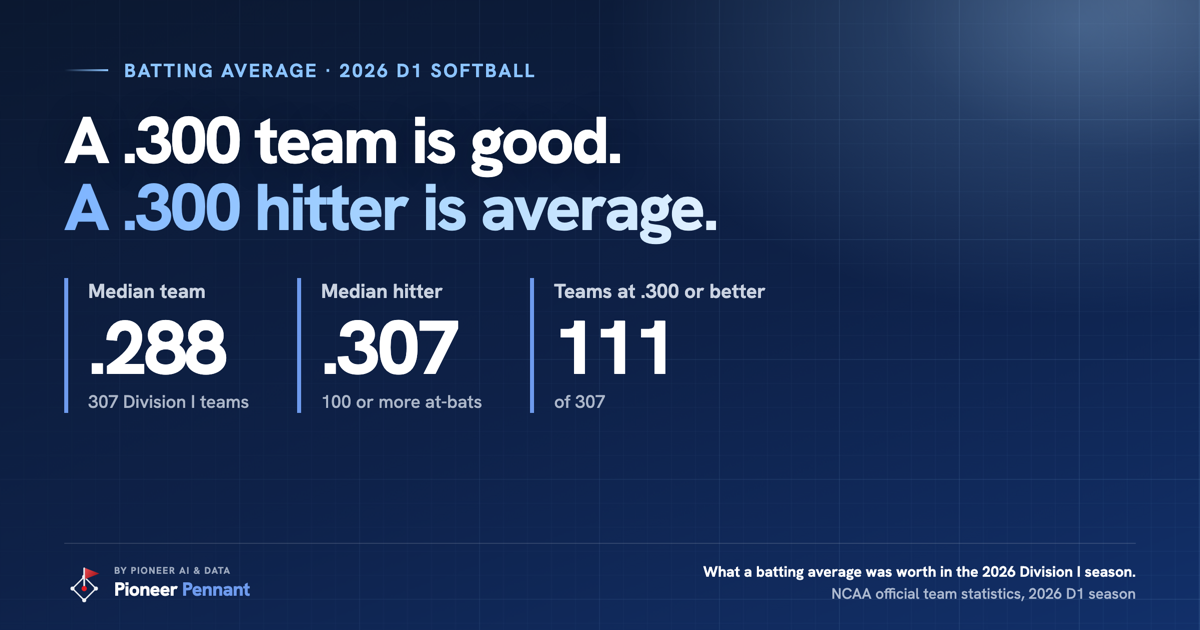
Ask anyone at a softball field what a good batting average is and the answer comes back at once: .300. Nobody says what it is a good average against, a team or a hitter, a Big 12 lineup or a Patriot League one. So I took the NCAA's official 2026 season statistics for every Division I team on the Pioneer Pennant Charts site and counted. In the 2026 Division I season .300 was a good team batting average and a perfectly ordinary hitter's average, and the difference between those two sentences is most of the answer.
The median hitter with 100 or more at-bats hit .307, so a .300 hitter sat just under the middle.
Team batting averages ran from .215 to .384, a gap of 169 points.
What is a good team batting average in college softball?
A team batting average of .300 is good in college softball: 111 of the 307 Division I teams in 2026 reached it, 36.2%, while the median team hit .288. Batting average is hits divided by at-bats, and the NCAA rules book defines an at-bat in Rule 14.1.2 as "A plate appearance that does not include sacrifices, hit by pitch, base on balls, gaining first base by interference, obstruction, or an incomplete turn at bat." Walks and hit batters are not counted as at-bats, which matters later. All 307 teams together had 122,899 hits in 421,718 at-bats, a .291 average.
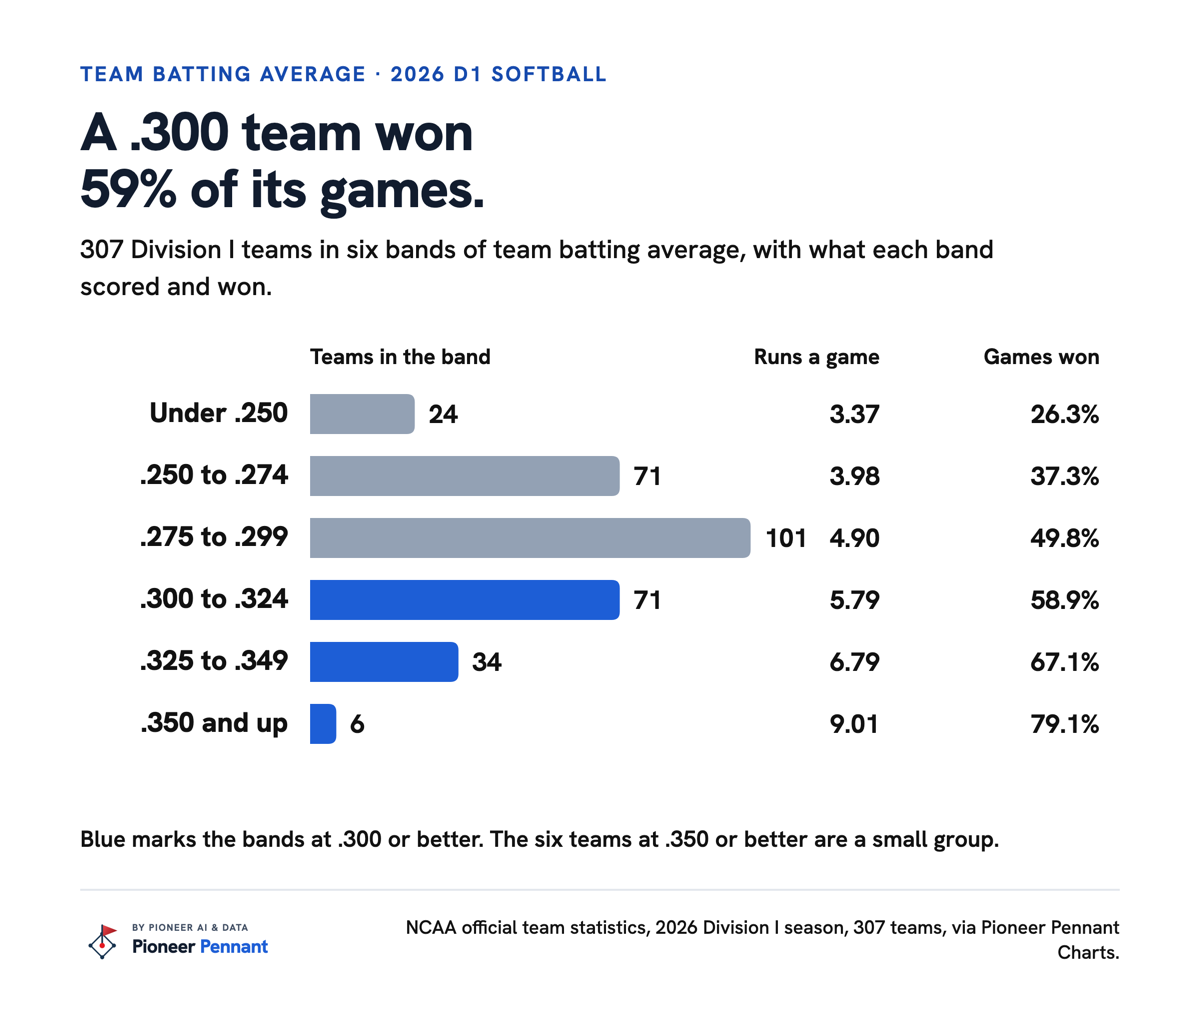
The table groups the 307 teams into six bands of 25 points and shows what each band scored and won.
| Team batting average | Teams | Runs per game | Games won |
|---|---|---|---|
| Under .250 | 24 | 3.37 | 26.3% |
| .250 to .274 | 71 | 3.98 | 37.3% |
| .275 to .299 | 101 | 4.90 | 49.8% |
| .300 to .324 | 71 | 5.79 | 58.9% |
| .325 to .349 | 34 | 6.79 | 67.1% |
| .350 and up | 6 | 9.01 | 79.1% |
The .275 to .299 band, a hundred teams in the middle of the sport, won almost exactly half its games, and a .300 team won 58.9%. Each step up from the lowest band to the .325 band went with between 0.6 and 1.0 more runs a game, and the six teams at .350 or better averaged 9.01 runs a game, a small group that deserves a small-sample warning. The best team average of the season was Oklahoma's .384, and the lowest was .215.
What is a good batting average for one hitter in college softball?
For a hitter who played regularly in 2026, .307 was the middle, so .300 was a solid average and not an unusual one: 54.2% of Division I hitters with at least 100 at-bats hit .300 or better, 1,194 of 2,204. More than one regular in five hit .350 or better: 487 of those 2,204, or 22.1%. A .400 hitter was rare: 122 of them, 5.5%. At the other end, 346 regulars (15.7%) hit under .250.
Most of the pages that rank for this question draw the line at .300 for good and .350 for exceptional. The .300 line marks the middle of the regulars, not the top of them, and the .350 line marks the top fifth and a bit more.
Where the middle sits depends on whom you count, because coaches keep the hitters who hit in the lineup. With at least 50 at-bats the median hitter was at .288, across 3,172 hitters. With at least 100 it was .307, and with at least 150 at-bats, which leaves 819 full-time hitters, it was .335. Any batting average you read comes with a minimum number of at-bats whether the page says so or not.
The at-bats matter for a second reason. Over 100 at-bats the usual wobble in a batting average is about 46 points, the standard error of a hitter whose true average is .300 (the square root of .300 times .700, divided by 100). A hitter who finishes at .270 and one who finishes at .330 over a season of 100 at-bats may be the same hitter.
Does .300 mean the same thing in every conference?
No: the median team in the Big 12 hit .320 in 2026 and the median team in the Atlantic 10 hit .270, a 50-point gap. A .300 team was below the middle of the Big 12, where 3 of its 11 teams finished under .300. In 24 of the 30 conferences with six or more teams the median team hit under .300, so a .300 team was above the middle there, and none of the 9 Atlantic 10 teams reached .300.
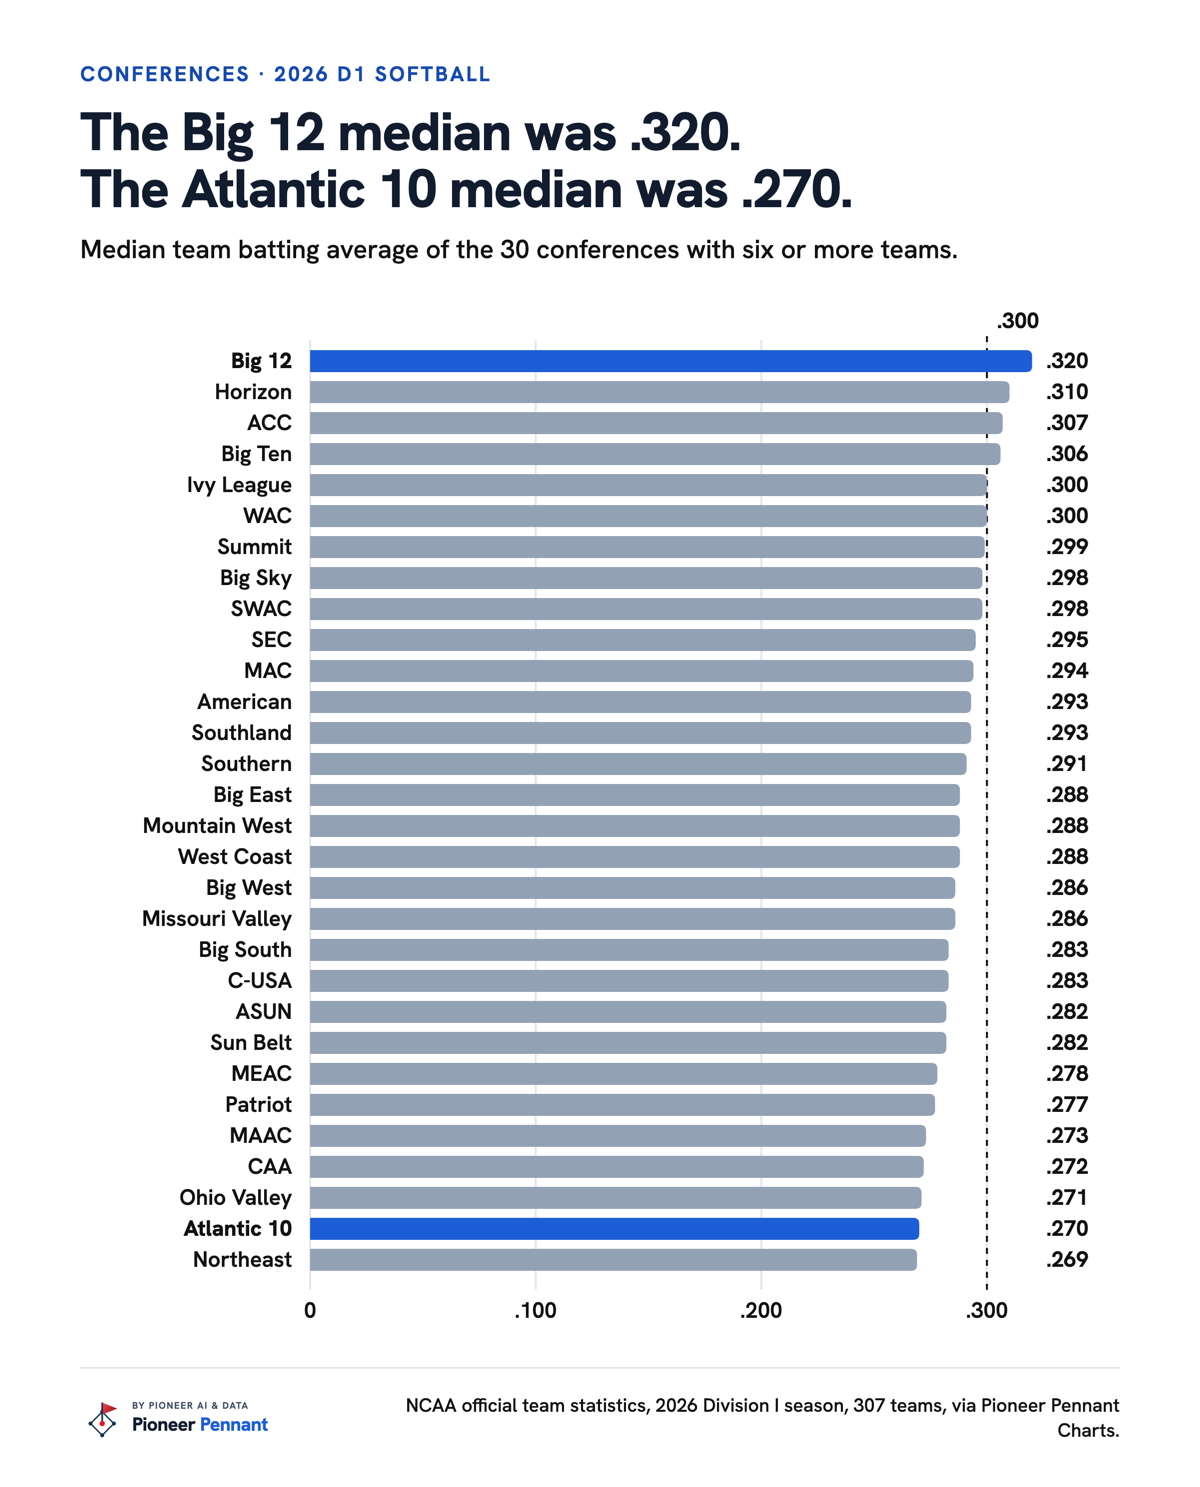
A conference's number is a count of what its teams hit, not a measure of how good its hitters are. Each team's schedule, ballparks and pitching are inside it. That is why a hitter's average needs her team's league next to it before it means anything.
What does batting average leave out?
Team batting average followed runs closely in 2026, and on-base percentage followed them more closely: across the 307 teams, batting average accounted for 82% of the differences in runs per game and on-base percentage accounted for 88%. Each 10 points of team batting average went with 0.38 more runs a game. Batting average accounted for 55% of the differences in win percentage.
The gap between those two numbers is the walks. Batting average leaves out walks and hit batters, and on-base percentage counts them. What a hitter's count is worth shows how large that gap gets: at-bats that reached 3-0 finished at .316 and were on base .778 of the time.
What to tell your hitter about her batting average
Tell her to read her average against her own team, her own league and her own at-bats, not against .300. A .300 on 120 at-bats is a regular's average in the middle of the sport. The same .300 on 40 at-bats says almost nothing yet. The number worth tracking next to it is on-base percentage, which counts the walks her batting average ignores.
Every Division I team's 2026 season sits on the free Charts site, Oklahoma's .384 season included, and the composite rankings show where each program landed.
Method: team batting averages are the NCAA's official 2026 season statistics for each team, summed from its players' hits and at-bats through each team's last game of the season, as collected by Pioneer Pennant Charts. The 307 teams are the Division I teams with at least 30 box scores in the Charts warehouse; that is 307 of the 308 Division I teams. Hitter figures use the NCAA's official player lines for the same teams, counting players with at least 100 at-bats, and no player is named. Averages are rounded to three places before they are sorted into bands, so a team shown at .300 is counted at .300. Conference medians are the middle team of the conference, or the average of the middle two. Runs per game and games won are the official totals of the teams in each band. The .288 in earlier posts is the average over the at-bats in the 6,351 games with pitch-by-pitch records, which is why it differs from the .291 here. Every number was re-checked by code against the warehouse before the post went out.
See the whole 2026 season.
Every D1 team, count leverage, spray charts, run expectancy, and the sabermetric rankings behind this post. Free.