"Get ahead in the count" is the one thing every adult at a softball field already agrees on. It gets yelled at the pitcher and at the hitter in the same half inning, by people who would argue about everything else on the field. Nobody ever says what a hitter's count is actually worth, so I went and counted. The numbers below come from the 380,536 plate appearances of the 2026 Division I season that the Pioneer Pennant Charts warehouse holds a pitch-by-pitch record for, each one asked how it ended.
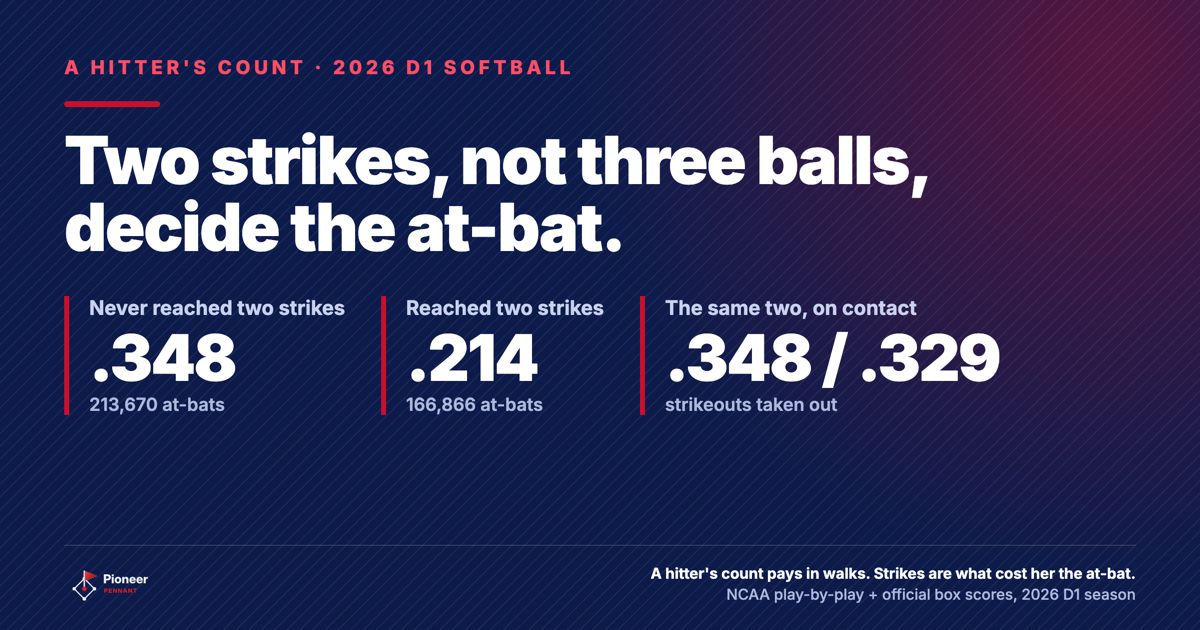
At-bats that reached 0-2 finished at .199, on base .238.
Once she put the ball in play, those same two groups hit .366 and .319.
Read the third line again. A 3-0 count and an 0-2 count sit 117 points of batting average apart, and almost none of that gap is about hitting the ball better.
What a hitter's count is, and what all twelve of them were worth
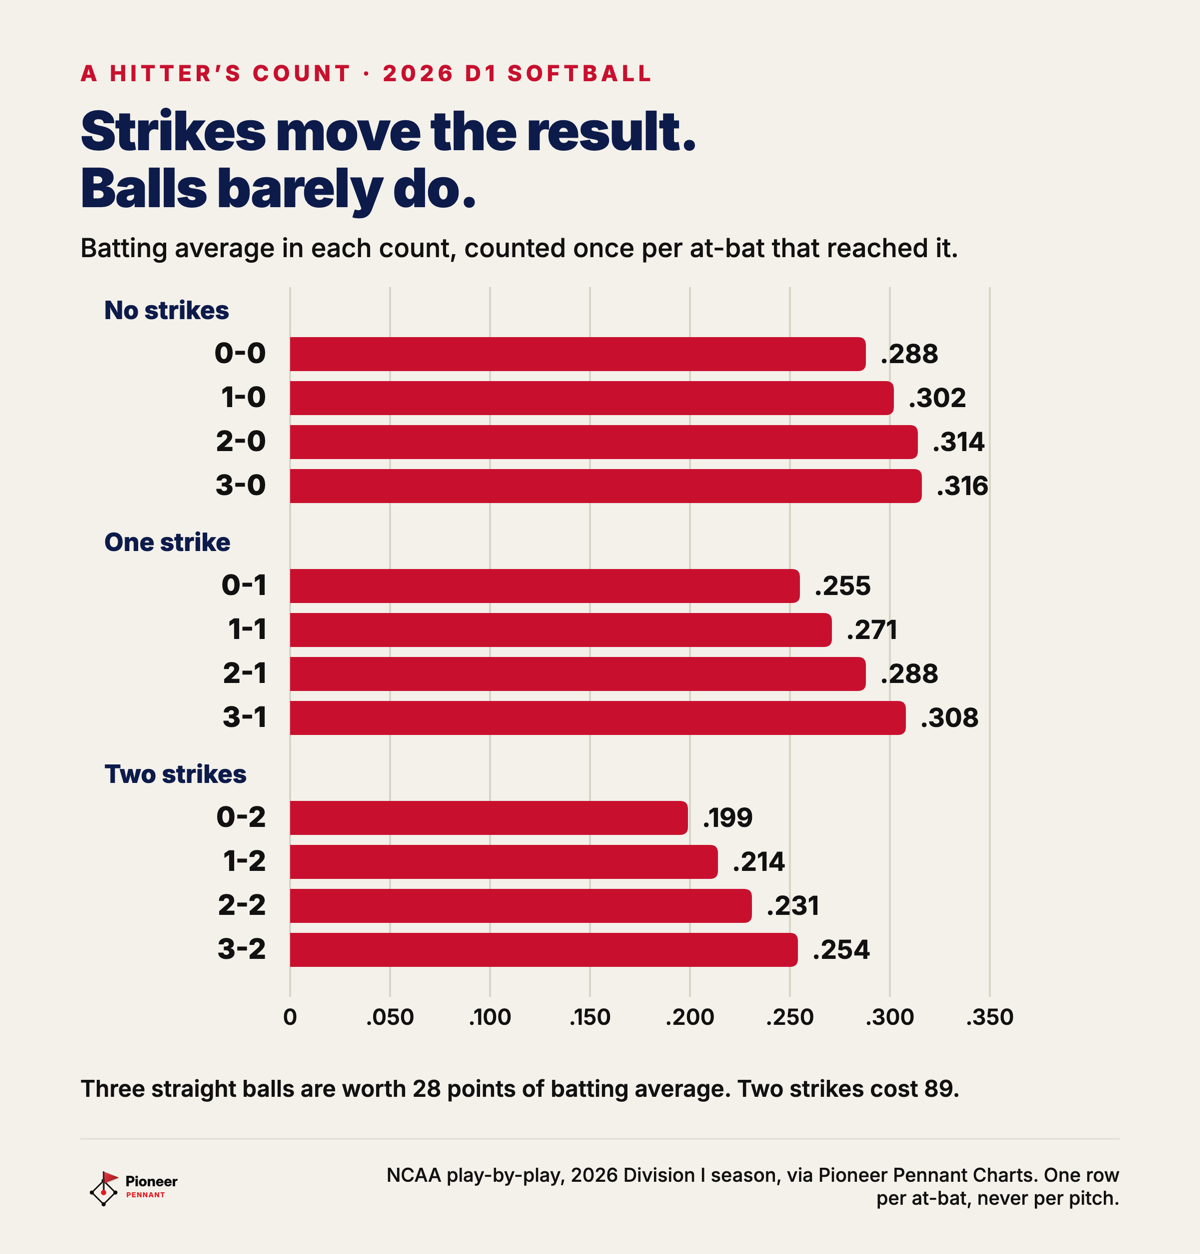
A hitter's count is any count with more balls than strikes: 1-0, 2-0, 3-0, 2-1, 3-1 and 3-2. The counts with more strikes than balls are the pitcher's: 0-1, 0-2 and 1-2. The even counts are 0-0, 1-1 and 2-2. In the 2026 Division I season the twelve of them were worth anywhere from .199 to .316 in batting average, and from .238 to .778 in on-base percentage, depending on which box the hitter was standing in.
| Count | At-bats reaching it | Batting average | On base |
|---|---|---|---|
| 0-0 | 380,536 | .288 | .375 |
| 0-1 | 158,672 | .255 | .310 |
| 0-2 | 57,917 | .199 | .238 |
| 1-0 | 166,567 | .302 | .442 |
| 1-1 | 143,029 | .271 | .360 |
| 1-2 | 90,855 | .214 | .275 |
| 2-0 | 64,241 | .314 | .563 |
| 2-1 | 83,475 | .288 | .451 |
| 2-2 | 80,159 | .231 | .346 |
| 3-0 | 23,870 | .316 | .778 |
| 3-1 | 40,834 | .308 | .638 |
| 3-2 | 50,896 | .254 | .509 |
On-base percentage is how often a plate appearance ends with the hitter on first base or better, walks and hit batters included. Batting average leaves the walks out. The 0-0 row is the whole season, because every at-bat starts there: 380,536 of them, hitting .288 and reaching base .375 of the time.
The instructional pages that rank for "hitter's count" do put numbers on it, and two of those numbers are checkable against the 2026 Division I season. The best hitter's counts are supposed to produce averages in the mid .300s, and that one is close: 2-0 came in at .314 and 3-1 at .308. Falling behind is supposed to drop a hitter under .180, and that one is nowhere near it. At-bats that reached 0-1 finished at .255, and at-bats that reached 1-2 finished at .214.
Three straight balls are worth 28 points of batting average. Two strikes cost 89.
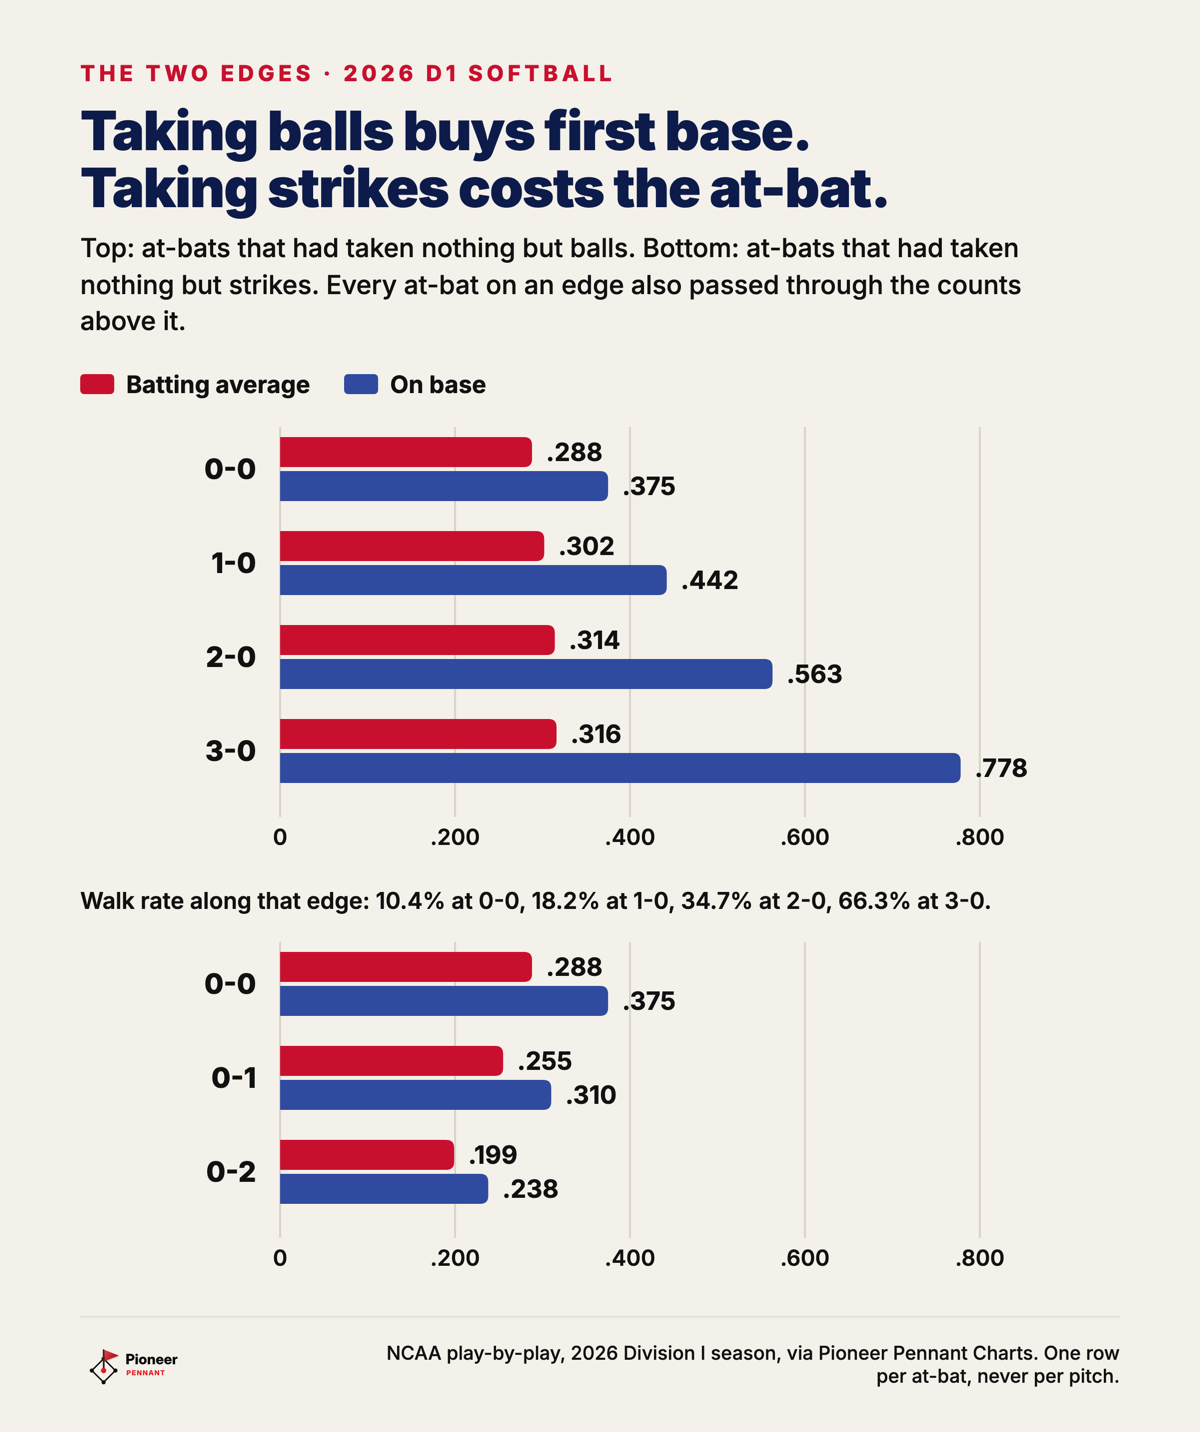
Walking the count out in a hitter's favor barely moves her batting average, and taking two strikes collapses it. Along the top edge of the grid, where she has taken nothing but balls, the season reads .288 at 0-0, .302 at 1-0, .314 at 2-0, .316 at 3-0. That is 28 points of batting average for three straight balls. Down the left edge, where she has taken nothing but strikes, it reads .288, .255, .199. Two strikes took 89 points off in two pitches.
Each edge of the grid is the same group of at-bats narrowing, which is what makes the comparison fair. Every at-bat that reached 3-0 also passed through 1-0 and 2-0, because there is no other way to get there. Every at-bat that reached 0-2 also passed through 0-1.
Balls and strikes are not two sides of one dial. They do different jobs, and only one of them has much to do with hitting. Division I hitters behave as though they know it: their swing decisions move in a straight line with strikes and barely move with balls (what Division I hitters actually swing at). The outcomes agree with the swings.
What a hitter's count actually buys is first base, not a hit
Getting ahead in the count pays a Division I hitter almost entirely in free bases. The walk rate along that top edge runs 10.4% of plate appearances at 0-0, 34.7% at 2-0, and 66.3% at 3-0, while the batting average moves 28 points. On-base percentage goes from .375 to .778 across the same three pitches, a 403-point climb built almost entirely out of walks.
The rulebook is doing most of that work. Under Rule 1.1 of the 2026 and 2027 NCAA Softball Rules Book, a base on balls is "an award of first base granted by the plate umpire to the batter who, during their time at bat, receives any combination of four pitches or awards that are declared balls." At 3-0 the hitter is one declared ball from the award, and two thirds of the time she gets it.
Some of those walks were on purpose, and they are inside the numbers rather than missing from them. NCAA softball has no no-pitch intentional walk: Rule 10.15 scores an intentional base on balls only when "the pitcher purposely throws ball four," and requires that "all pitches must be legally pitched to the catcher," with skipping them awarding the batter nothing. A coach who wants a hitter on first has to throw four balls to get her there, so every intentional walk in the sport passes through 3-0.
Once she puts the ball in play, the count almost stops mattering
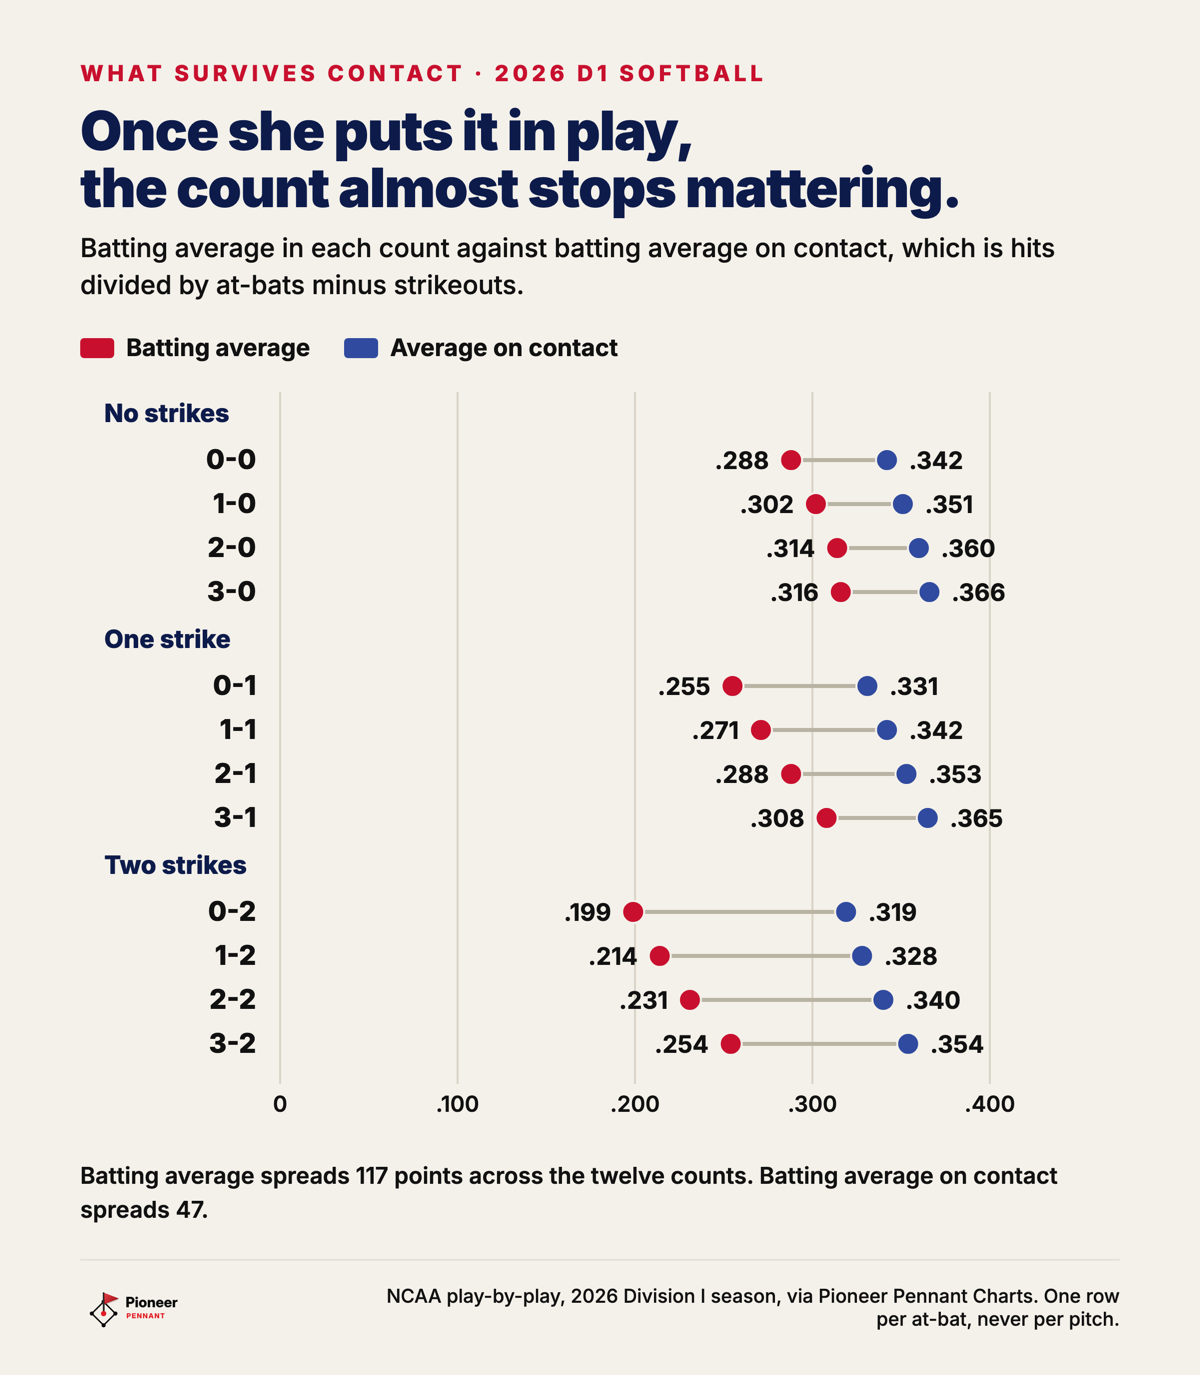
The gap the count opens is a strikeout gap, not a contact gap. Split the season in two and at-bats that never reached two strikes hit .348, while at-bats that did hit .214. That is 134 points of batting average between the two halves of one season. Now take the strikeouts out and ask what she did when she actually hit the ball: .348 against .329. Nineteen of those 134 points survive contact.
The mechanism is the strikeout itself, which Rule 1.22 of the NCAA rules book defines as "a putout that is credited to the catcher as a result of the batter being charged with three strikes in a single at-bat." Across all twelve counts, batting average on contact (hits divided by at-bats minus strikeouts) runs from .319 at 0-2 up to .366 at 3-0, a 47-point spread. Batting average itself runs from .199 to .316, a spread of 117. The .366 at 3-0 rests on 6,635 balls in play out of 23,870 at-bats, the smallest group quoted here and still a large sample.
The sport has been teaching the right thing for the wrong reason. Shortening up with two strikes is good advice, and the payoff is not a better result on contact. The payoff is contact at all.
Three balls, on their own, were worth nothing to a hitter's average
At-bats that reached three balls hit .282 in the 2026 Division I season, below the .288 the whole season hit, across 84,543 at-bats. At-bats that reached three balls also reached base .627 of the time and drew a walk in 46.8% of them. Three balls were worth nothing to a Division I hitter's average and almost everything to her on-base.
The usual ahead, even, behind split says the opposite, and it is built in a way that buries the reason. Those three buckets are counted per pitch, so a single at-bat lands in two or three of them depending on how its count wandered, and "three balls and no strikes" gets averaged in with "three balls and two strikes" as though a hitter were in the same place.
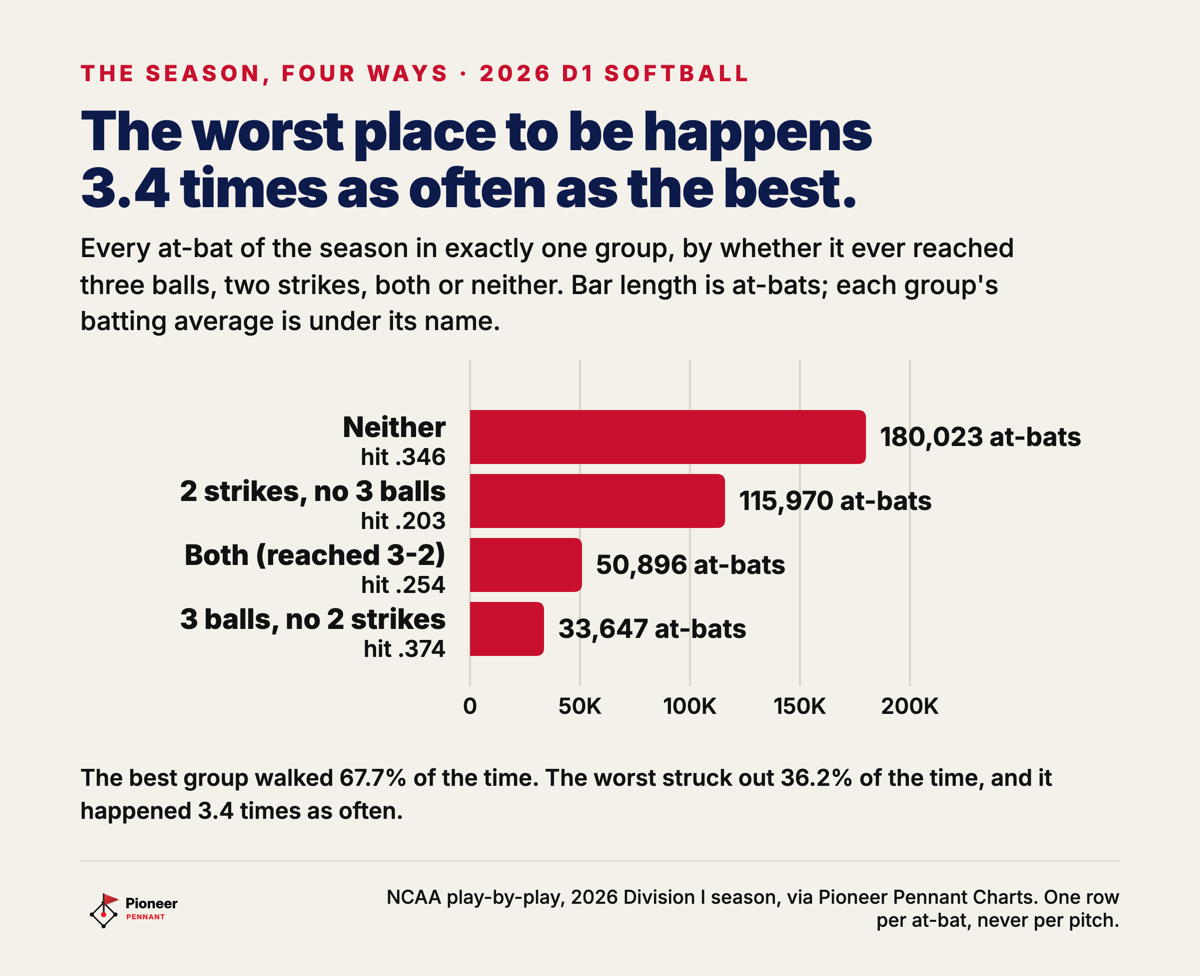
The honest version splits the season four ways, with every at-bat in exactly one group. Of the four, at-bats that reached three balls and never two strikes are the best place to be: 33,647 of them, hitting .374, slugging .624, on base .807, walking 67.7% of the time. At-bats that reached two strikes and never three balls are the worst: 115,970 of them, hitting .203, slugging .300, on base .212, striking out 36.2% of the time. Slugging percentage is total bases per at-bat, so .624 against .300 is about double the damage on every swing.
The worst group happened 3.4 times as often as the best one, and that ratio is what should decide how a practice gets spent.
What to tell your hitter about a hitter's count
Tell her the count pays in two ways. Taking balls buys first base, which is worth having and will not raise her average. Taking strikes costs her the at-bat, and 43.9% of Division I at-bats got to two strikes in 2026, so almost half the season is played in the expensive half of the grid.
If you keep one new number on your hitter this spring, keep the share of her at-bats that reach two strikes. An at-bat that never gets there is hitting .348 before anybody does anything clever, and the pitches that decide whether she gets there are the early ones, which is the other half of what one first pitch is worth.
A hitter standing at 2-0 does not need a different swing. She needs to know what 2-0 already is: a .314 average and a walk in 34.7% of those at-bats, with one more ball turning it into .316 and 66.3%. Almost all of the reward for getting ahead arrives without a swing, so the pitch she cannot afford is the strike she gives back chasing something she was never going to hit.
Method: one row per plate appearance, never per pitch. A count's figures cover every plate appearance with a pitch-by-pitch record that saw a pitch in that count, counted once, and the at-bat is credited with however it finished. That distinction matters at two strikes, because Rule 11.3.3.4 charges a foul ball as a strike only "when the batter has fewer than two strikes," so a two-strike at-bat can run long without the count moving: 71,738 pitches were thrown at 3-2 in 2026 but 50,896 at-bats reached it. At-bats that reached three balls are also at-bats in which the pitcher missed three times, so the numbers describe the situation rather than the hitter alone. Pitch sequences come from the NCAA's free public play-by-play for 6,351 of the 8,161 Division I games of the 2026 season, reconstructed and validated against official box scores. Reconstruction is not perfect, and a small number of sequences are missing a pitch, which is why the at-bat totals along an edge of the grid are very nearly nested rather than exactly so; the method is on the Charts open data pages. Every number in this post was re-checked by code against the warehouse before the post went out, and a post whose numbers disagree with the data does not publish.
Figuring out where your player fits in college?
Pioneer Pennant Process covers all 978 NCAA softball schools: coaches and how to reach them, cost after aid, majors, and a fit score built on one rule. Go where you are going to play, not as high as you can go.