"She hit that a mile" is the compliment every softball bleacher hands out for a long fly ball, and it is not the same as "that was a good at-bat." I wanted to know what a ball is actually worth at each distance, so I went and counted. The numbers below come from the 2026 Division I softball season: 5,434 balls in play, in 133 games, where the scorer's software recorded where the ball ended up. Every one is in the Pioneer Pennant Charts warehouse.
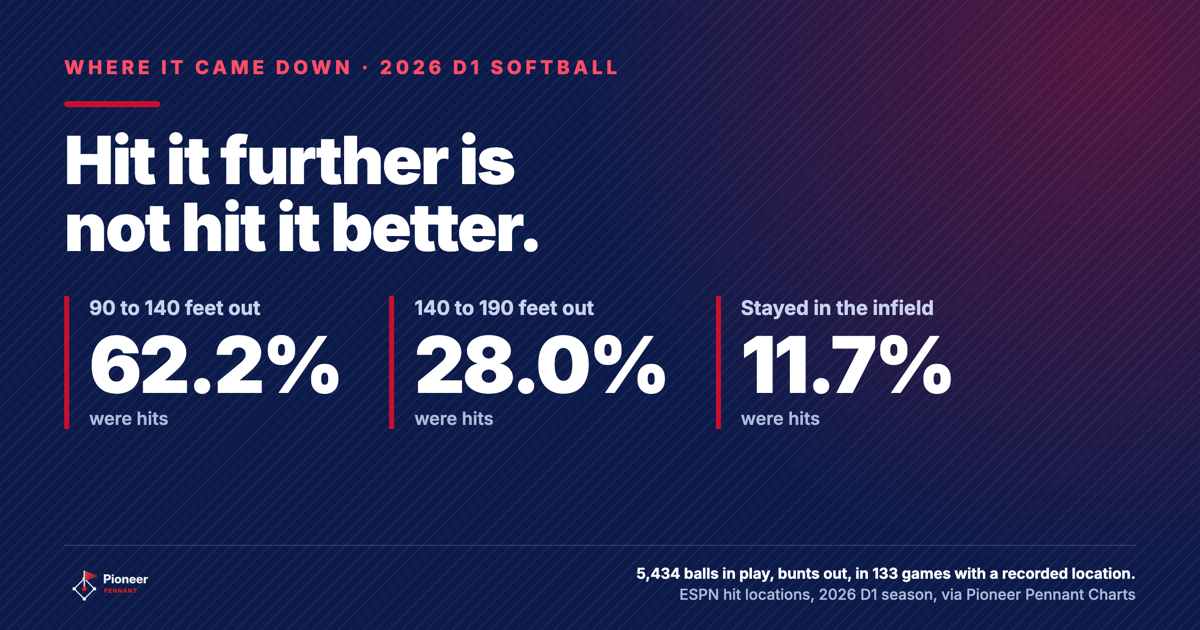
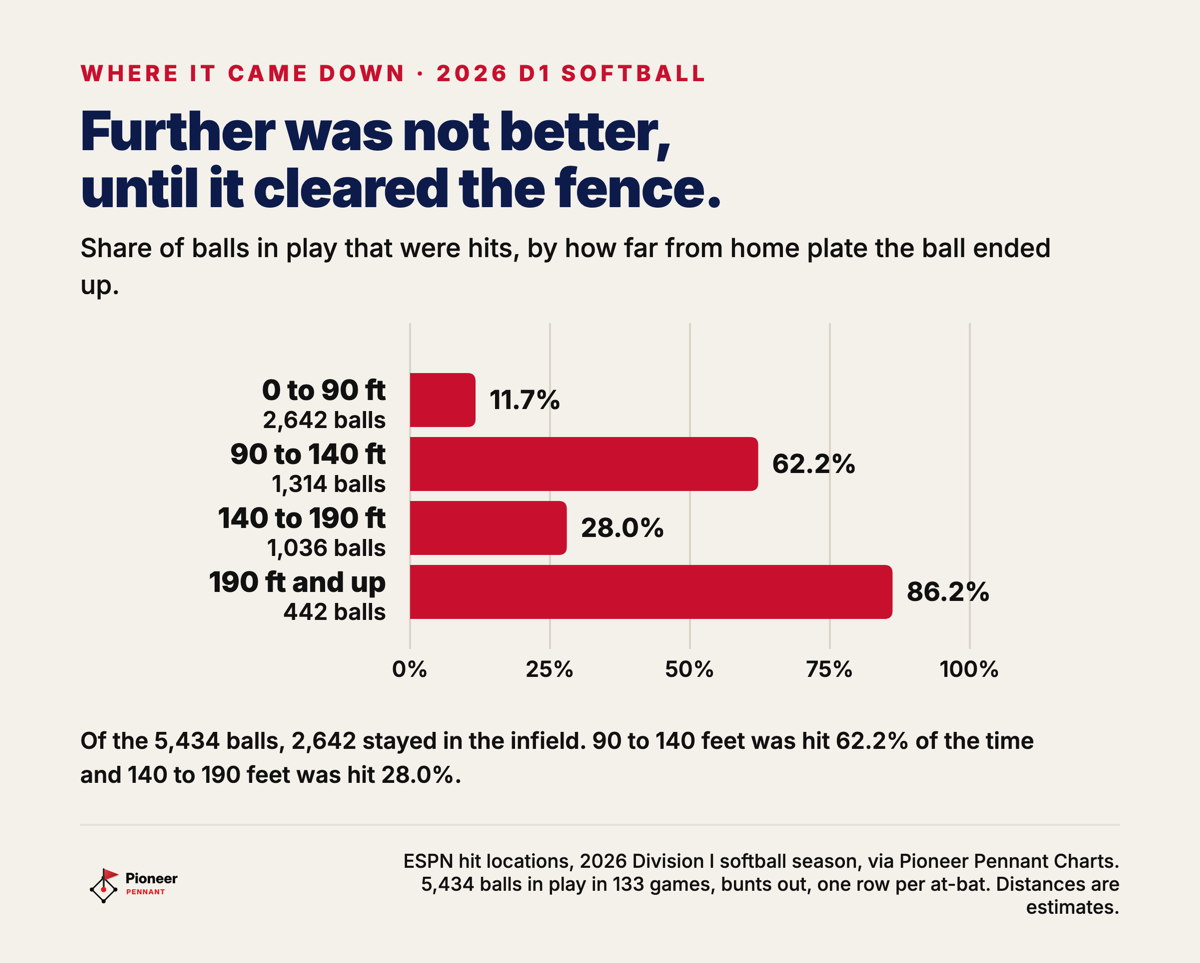
Balls that came down 90 to 140 feet from the plate: hits 62.2%.
Balls that came down 140 to 190 feet from the plate: hits 28.0%.
Balls that reached 190 feet or more: hits 86.2%, and 298 of the 381 hits were home runs.
The second and third lines are the whole post. Between the infield and the fence, the ball that went further was a hit less than half as often.
What does "batted ball distance" mean in these numbers?
Batted ball distance here is how far from home plate the ball ended up, measured from the location the scorer's software recorded for each ball in play. A ball in play is a plate appearance that ended with the ball put in play: a hit, a fly out, a ground out, a fielder's choice, a sacrifice fly or an error. Strikeouts, walks and hit batters are not in it, and neither are bunts, which are a different batted ball with a different job.
The recorded spot is where the play ended, not a launch measurement. It says where the ball came down or was fielded, which is the thing that decides a hit, and it says nothing about how hard it was struck or at what angle. The distances come from converting the coordinates to feet, and the scale is Pennant's estimate, fitted to where home runs clear the fence. Treat the band edges as approximate. The scale caveat is in the method note at the bottom, with the check that the ordering survives it.
How often does a ball hit 90 to 140 feet become a hit?
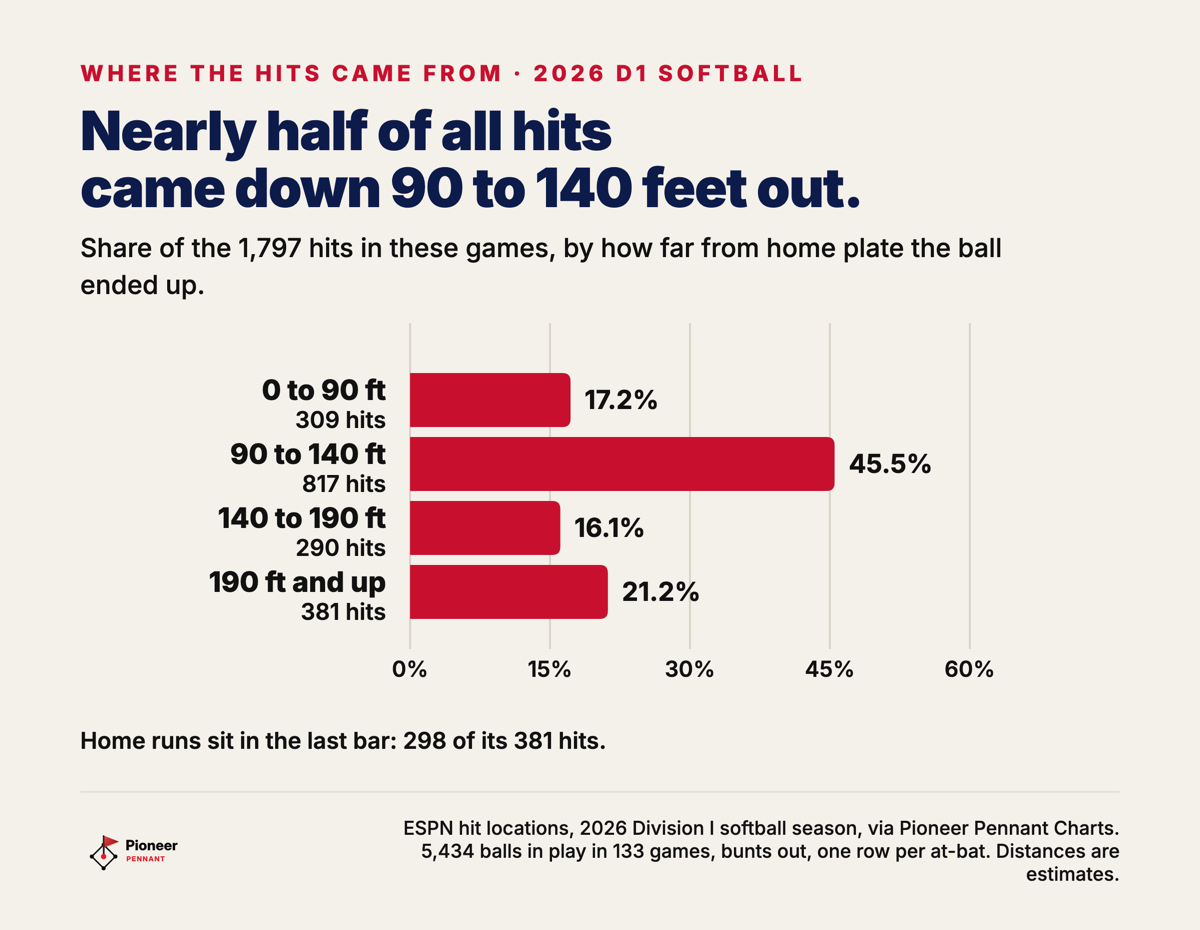
A ball that came down 90 to 140 feet from the plate was a hit 62.2% of the time, the best of the three bands that stay in the park. That band held 1,314 of the 5,434 balls (24.2%) and produced 817 of the season's 1,797 hits in these games, which is 45.5% of all of them.
Those are the balls that clear the infielders and land in front of the outfielders: singles through the gap, bloops, line drives that drop. Of the band's 1,314 balls, 745 were singles. A ball at that distance is a hit for the same reason a ball in the infield is not: the people whose job it is to catch it are standing somewhere else.
Why does a ball that goes 140 to 190 feet get caught more?
A ball that came down 140 to 190 feet from the plate was a hit only 28.0% of the time, because that is where the outfielders play. Of the 1,036 balls that landed there, 575 were fly outs, and a ball in that band is a hit less than half as often as one that landed 50 feet closer.
This is the warning track fly ball that feels fantastic coming off the bat. Nothing here says she should hit it softer. The ball that goes 150 feet and the ball that goes 200 feet came off the same swing, and the second one is a home run. What the data says is that the in-between distance is the only distance with an outfielder standing right under it.
How much contact stays in the infield, and what does it produce?
Nearly half of all balls in play never left the infield, and they were hits 11.7% of the time. Of the 5,434 balls, 2,642 (48.6%) came down within 90 feet of the plate, and 309 of them were hits. Those 309 are 17.2% of every hit in these games, from nearly half of the contact.
The infield is not a failure state. It is where the most plate appearances end, and a fast runner turns some of them into singles. It is the largest block of contact in these games and the one with the lowest ceiling.
Is the pattern real, or is it the games the scorer logged?
The pattern holds, with limits the reader should know about. Locations exist for 133 of the 620 games where Pennant holds a plate-appearance record with base-out state, and in those 133 games nearly every ball in play has one. The games ran from May 15 to June 5, and 121 of them include an SEC, Big 12, ACC or Big Ten team. That is late-season, mostly big-conference softball, not the whole sport.
Two things say it is not a strange slice. The hit rate on balls in play was 33.1% in these games and 33.3% in the other charted games over 19,969 balls. And when the distance scale moves 10% in either direction, the ordering does not: balls in the 90 to 140 foot band were hits 51.7% of the time against 43.5% for the 140 to 190 foot band on the shorter scale, and 66.8% against 31.6% on the longer one.
What to tell your hitter about distance
Tell her the distance is not the goal, the place is. A line drive into the gap that dies at 120 feet is worth more than a lofted ball to the warning track, and the ball that does clear the wall is the biggest prize there is: 298 of the 442 balls that reached 190 feet or more were home runs.
Keep one number on her next game: how many of her balls in play ended up between the infielders and the outfielders. It is a better scoreboard than how far anything went. The same logic runs through what a hitter's count is worth, where the at-bat is decided before the ball is ever hit. The season behind all of it is on the Charts season hub.
Method. Source: ESPN hit coordinates for the 2026 Division I season, via the Pioneer Pennant Charts warehouse, 5,434 balls in play (bunts and sacrifice bunts removed) across 133 games from May 15 to June 5. One row per plate appearance, never per pitch. A hit is a single, double, triple or home run; reaching on an error or a fielder's choice is not. Distance is the straight line from home plate to the recorded location, converted at an estimated 1.292 feet per coordinate unit, fitted to where home runs clear the fence; band edges are approximate. Errors almost never carry a location, so reached-on-error plays are mostly absent. An earlier internal version of this finding counted every pitch that carried the same location (fouls, the final pitch and the result), which inflated the sample to 20,481 rows and put the infield hit rate near 3%. This version counts each ball once. Every number was re-checked against the warehouse before the post went out.
See the whole 2026 season.
Every D1 team, count leverage, spray charts, run expectancy, and the sabermetric rankings behind this post. Free.