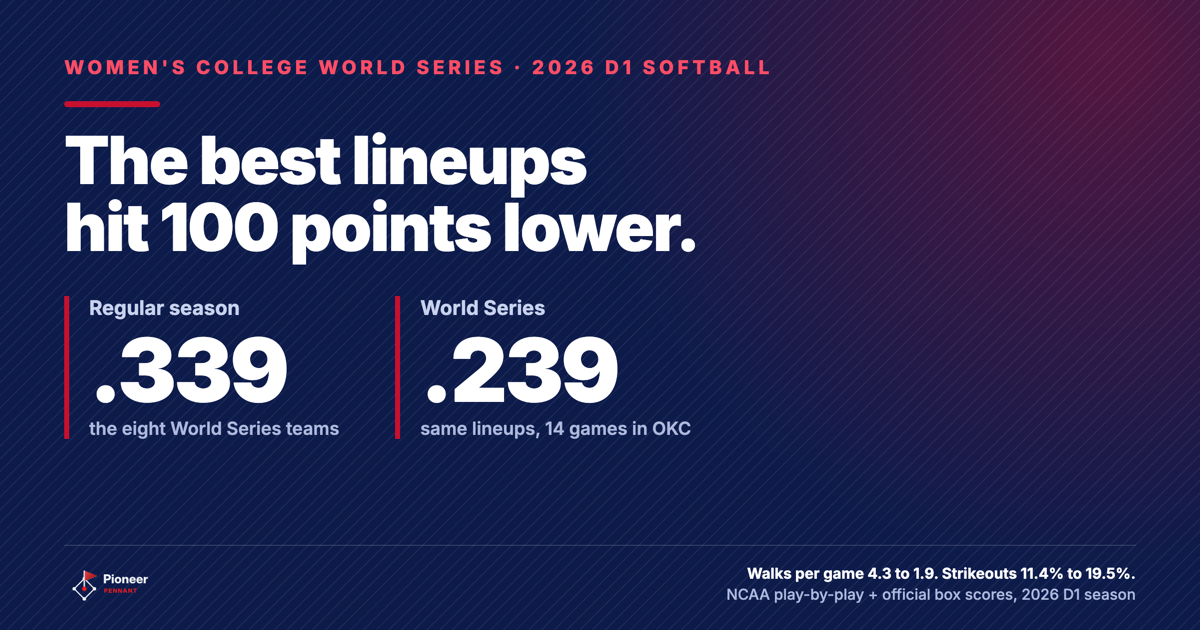
Every June somebody in the stands says the Women's College World Series is where the best hitters finally show up. The 2026 Division I numbers say the opposite, and it is not close.
So I took the eight teams that reached the 2026 Women's College World Series and compared each lineup with itself: its regular season against its 14 bracket games in Oklahoma City. Same hitters, same coaches. The only thing that changed was who was pitching.
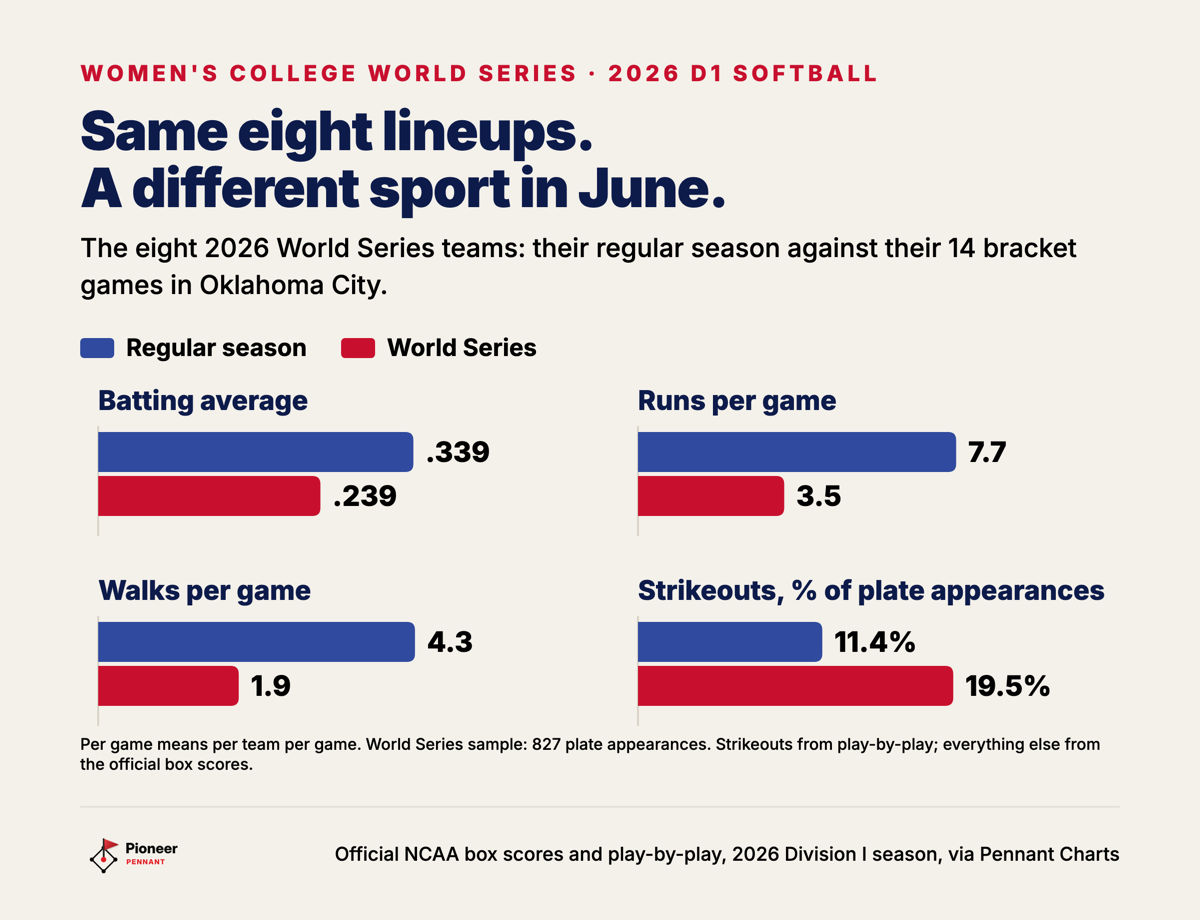
They scored 7.7 runs a game in the regular season and 3.5 in Oklahoma City.
Walks fell from 4.3 a game to 1.9, and strikeouts rose from 11.4% of plate appearances to 19.5%.
The whole 2026 bracket, replayed 50,000 times with each team's odds, is on the Pioneer Pennant Charts sabermetrics page.
The best lineups in the country hit 100 points lower at the Women's College World Series
The eight 2026 Women's College World Series teams hit .339 as a group across 420 regular-season team-games, and .239 in their 14 bracket games in Oklahoma City, by the official NCAA box scores. The best offenses in the country lost a full hundred points of batting average in about a week.
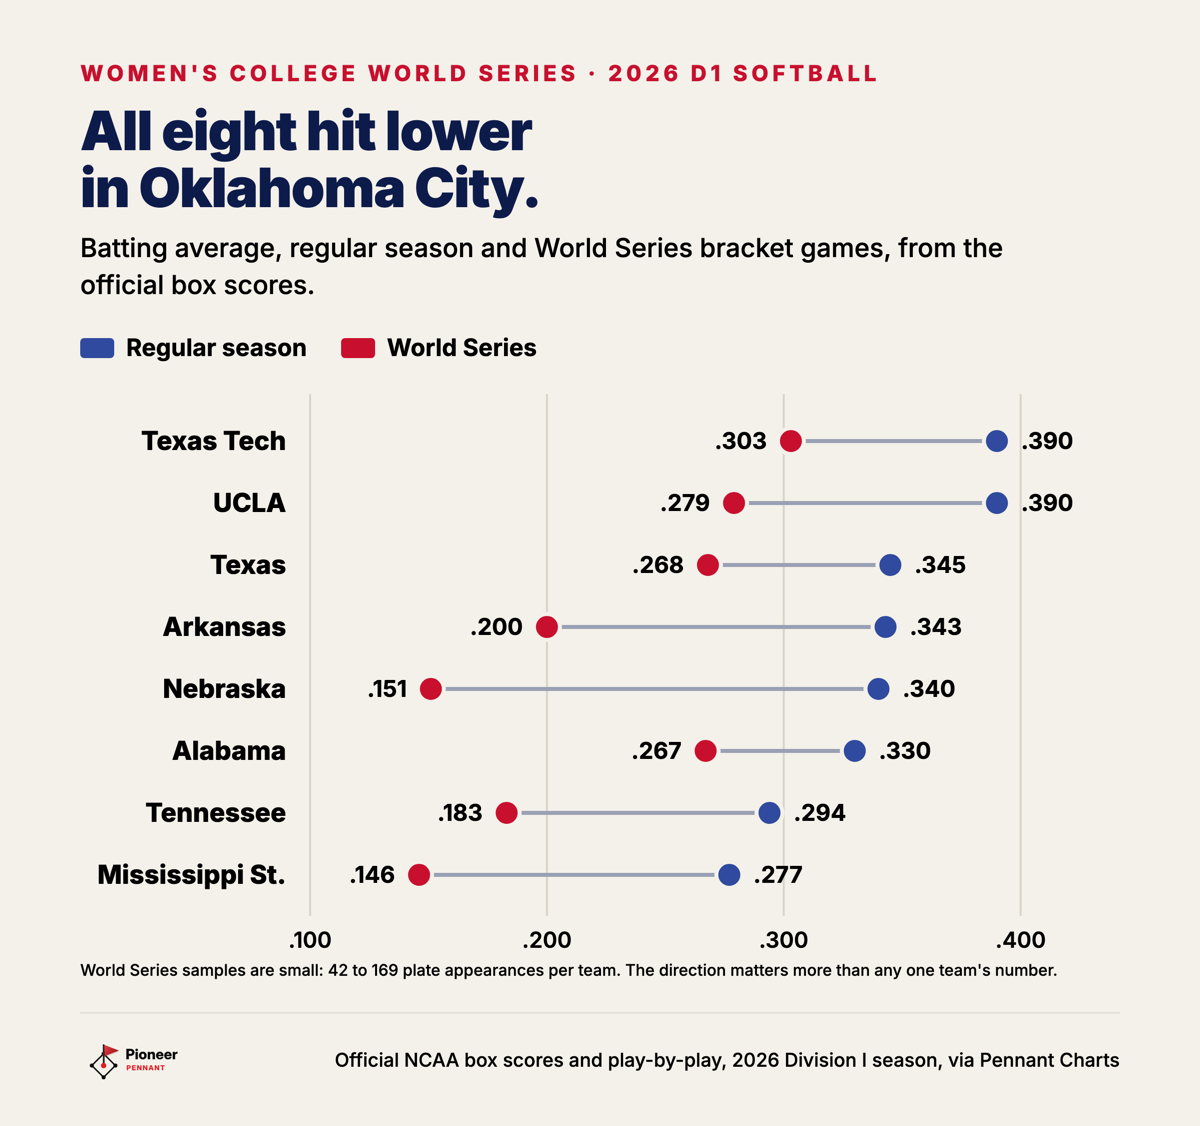
It was not one team's bad week, either. Every one of the eight hit for a lower average in Oklahoma City than it did all season. The smallest drop was Alabama's, from .330 to .267. The biggest was Nebraska's, from .340 to .151. Texas, the team that won it all, went from .345 in the regular season to .268 in its five bracket games, then swept Texas Tech in the final, according to NCAA.com. You can see the Longhorns' whole season on Texas's Pioneer Pennant Charts page.
The World Series is a small sample, 827 plate appearances over 14 games, and each team's share is between 42 and 169 plate appearances, so no single team's number means much by itself. The direction is what holds up. All eight moved the same way.
Walks disappear and strikeouts climb when the best pitching staffs meet
Walks and strikeouts moved more than anything else at the 2026 Women's College World Series. The eight lineups drew 4.26 walks per team per game in the regular season and 1.89 in Oklahoma City, a drop of more than half, and all eight walked less.
Strikeouts went the other way. The eight lineups struck out in 11.4% of their regular-season plate appearances and 19.5% of their World Series plate appearances.
That is what the best pitching staffs in the country look like when they pitch to each other. In the 2026 regular season, these same eight staffs held their opponents to a .200 average with a 27.0% strikeout rate. Texas's Teagan Kavan, the Most Outstanding Player, finished the World Series with 30 strikeouts in 33.1 innings and a 1.47 ERA, according to NCAA.com. Aces in elimination games do not pitch around anybody. The eight lineups saw a first-pitch strike (called, swinging, or fouled off) 39.7% of the time in the regular season and 47.5% of the time in Oklahoma City. Falling behind 0-1 costs a hitter more than most parents think, as the first-pitch numbers show.
By the way, the eight lineups still hit .239 against those staffs at the World Series, while the staffs' regular-season opponents hit .200 against them. The best hitters did beat the best pitching, just not by nearly as much as they beat everyone else.
Home runs held up better than anything else, but they did not go up
Home runs were the most durable part of these lineups at the 2026 Women's College World Series, and they still fell. The eight hit 1.77 home runs per team per game in the regular season and 1.32 in Oklahoma City, 37 in all. Home runs per game fell by about a quarter, the smallest drop of anything on the page, while runs per game fell by more than half.
Here is the trap, and I walked right into it the first time I cut this data. Compare the World Series with the whole country's regular season, and it looks like power goes up in June: 5.0 home runs per 100 at-bats in Oklahoma City against 3.1 for the country. But the country's number includes hundreds of lineups that were never going to Oklahoma City. These eight hit 6.8 home runs per 100 at-bats in their own regular seasons, so against themselves, their power went down too. It just went down the least.
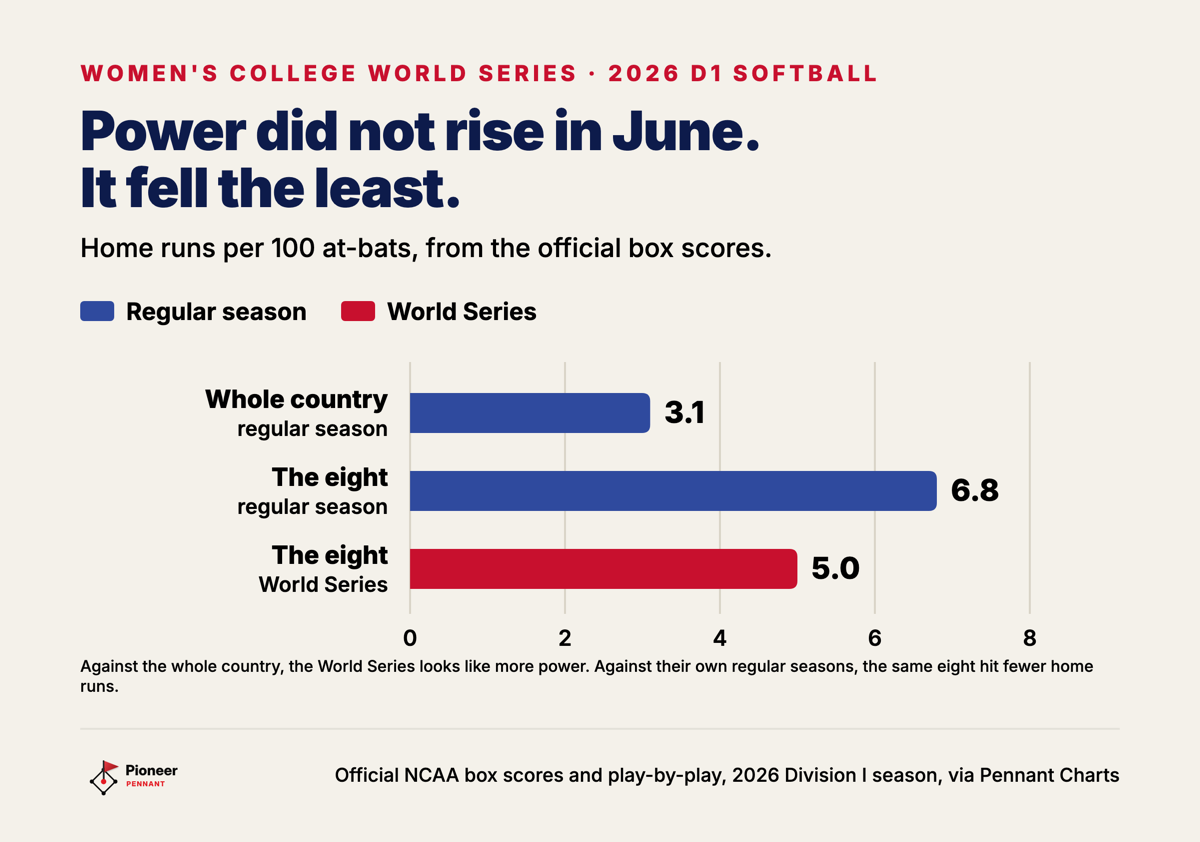
Compare a team with itself. Comparing the World Series with the whole country mostly measures who showed up.
What the World Series numbers mean for a player being recruited
A batting average means what the pitching behind it means. The best lineups in 2026 Division I softball lost a hundred points of average in about a week, just by facing pitching as good as they are. A travel-ball average built against a weak pool and one built against the best arms at a showcase are not the same number, and I would take the second one every time.
That is the idea Pioneer Pennant Process is built on: go where she is going to play, not as high as she can go. It scores every Division I and Division II program against your athlete's profile, so her list starts from where she will actually get on the field, not from the highest level she might reach.
Method: the eight are the teams that played a 2026 Women's College World Series bracket game. "World Series" means their 14 bracket games in Oklahoma City; the two-game final is left out. Batting average, runs, walks, and home runs come from the official NCAA box scores; strikeout rates come from play-by-play reconstructed from the NCAA's public feed, because box-score strikeouts are mostly blank. Per-game figures are per team per game. Every number in this post is re-checked by code against the dataset before the page builds, and the page refuses to publish if one disagrees.
Figuring out where your player fits in college?
Pioneer Pennant Process covers all 978 NCAA softball schools: coaches and how to reach them, cost after aid, majors, and a fit score built on one rule. Go where you are going to play, not as high as you can go.