Every spring I hear "be aggressive" and "work the count" shouted at the same kid in the same at-bat, by two adults who are both sure they are right. Softball hitting counts are the argument underneath it, and nobody ever settles it, because a box score does not keep the pitch.
So I went and counted. I pulled all 1,439,047 pitches of the 2026 Division I softball season out of the Pioneer Pennant Charts warehouse and asked one question of each: did she swing?
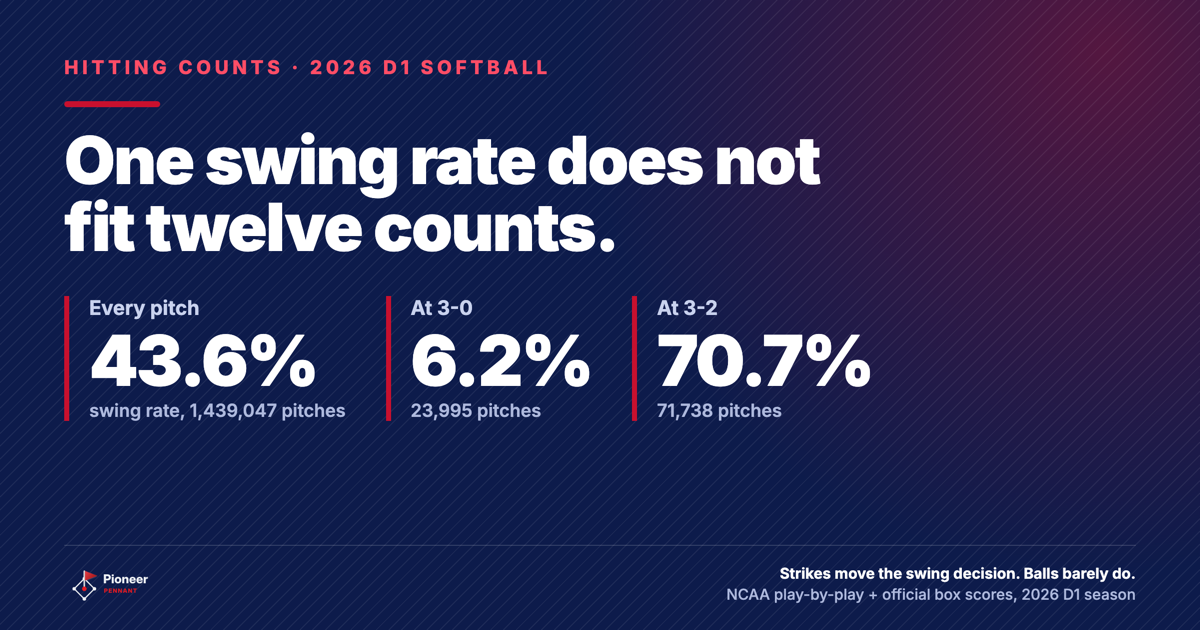
At 3-0 they swung 6.2% of the time, across 23,995 pitches.
At 3-2 they swung 70.7% of the time, across 71,738 pitches.
That is more than 64 points of swing rate between two counts that sit two pitches apart in the same at-bat. Every team's season behind those pitches is on the 2026 sabermetric season page.
Softball hitting counts, all twelve of them, by how often she swings
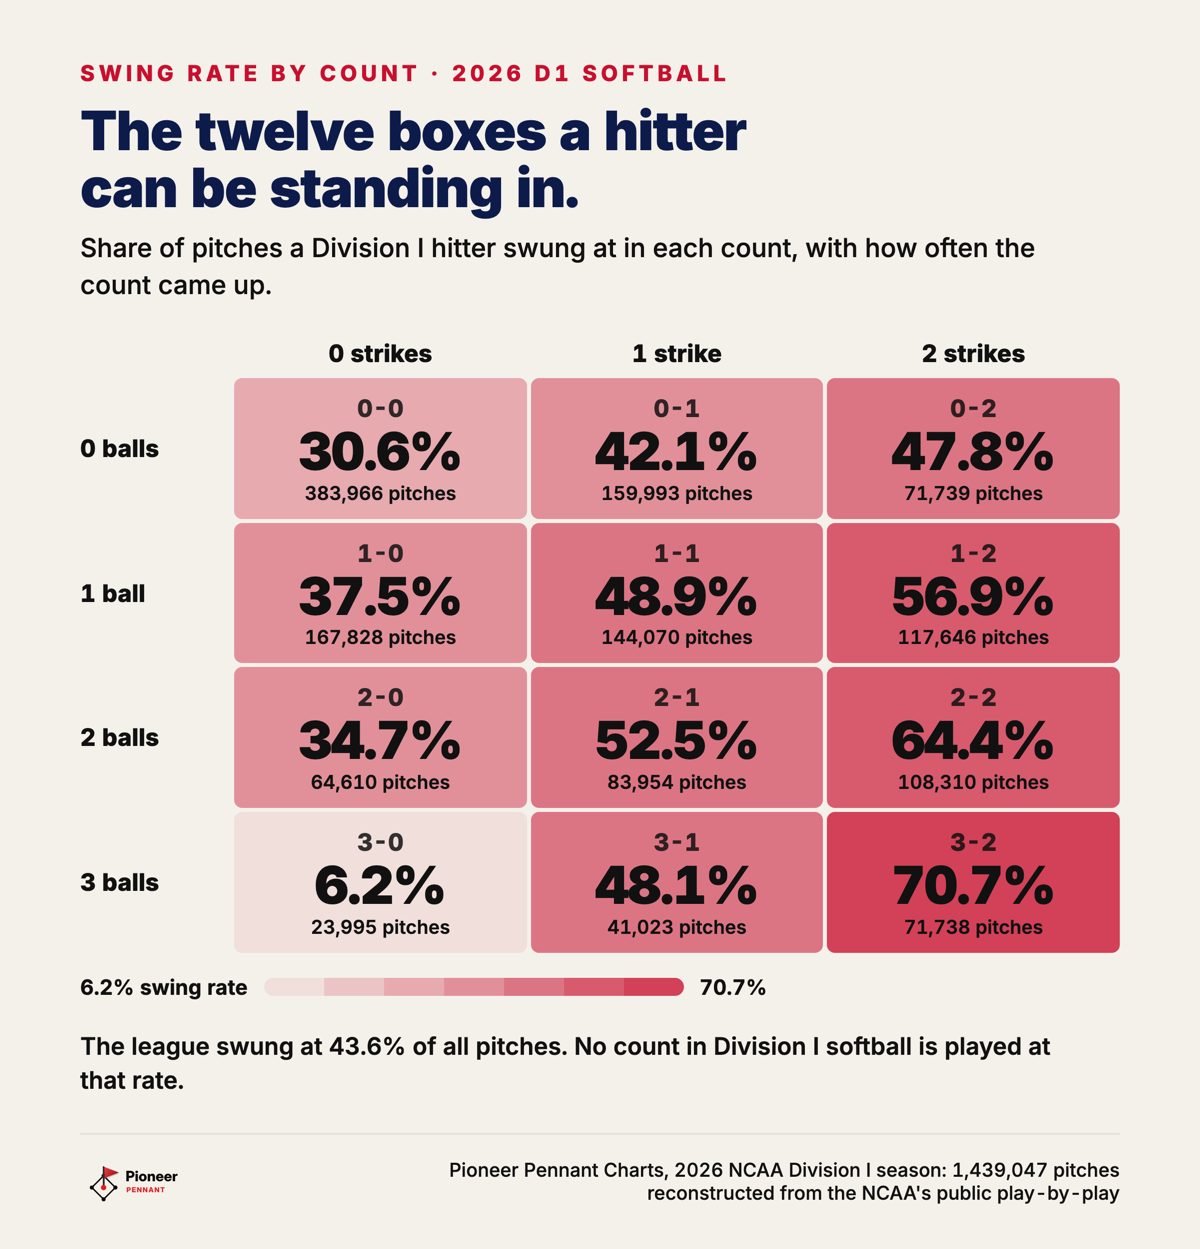
Division I hitters swung at somewhere between 6.2% and 70.7% of the pitches they saw in 2026, depending on the count. Here is every count, how often it came up, and how often she swung.
| Count | Pitches | Swing rate |
|---|---|---|
| 0-0 | 383,966 | 30.6% |
| 0-1 | 159,993 | 42.1% |
| 0-2 | 71,739 | 47.8% |
| 1-0 | 167,828 | 37.5% |
| 1-1 | 144,070 | 48.9% |
| 1-2 | 117,646 | 56.9% |
| 2-0 | 64,610 | 34.7% |
| 2-1 | 83,954 | 52.5% |
| 2-2 | 108,310 | 64.4% |
| 3-0 | 23,995 | 6.2% |
| 3-1 | 41,023 | 48.1% |
| 3-2 | 71,738 | 70.7% |
The league average of 43.6% describes nobody. No count in Division I softball is played at 43.6%, and the closest one is 0-1 at 42.1%, where a hitter has already fallen behind. An average swing rate is twelve different plans stacked on top of each other.
Nobody called the country into a meeting and taught it that grid. It is what happens when a few thousand hitters read the same situation the same way.
Strikes move the swing in a straight line. Balls do not.
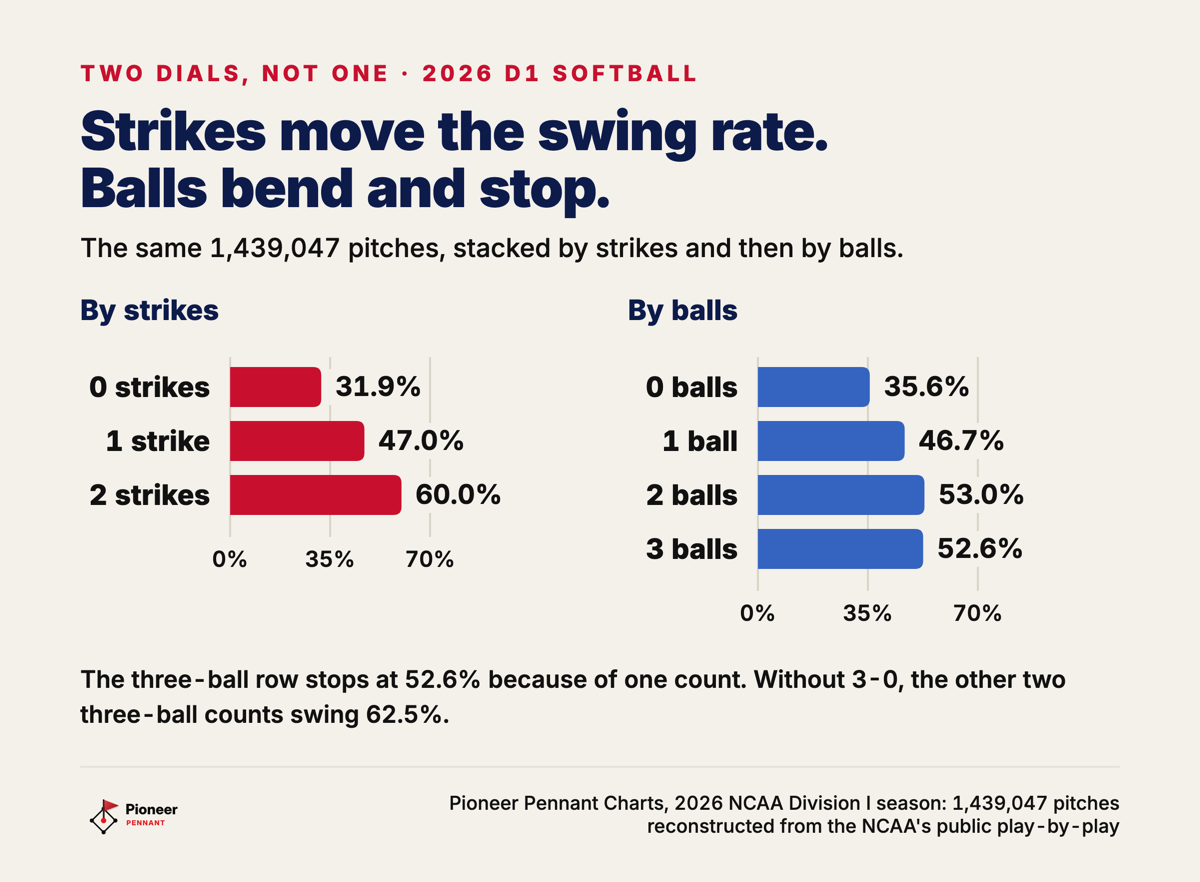
A Division I hitter's swing rate climbs straight up with strikes: 31.9% with no strikes, 47.0% with one strike, 60.0% with two. Stack the same season by balls instead and the line bends: 35.6% with no balls, 46.7% with one, 53.0% with two, then 52.6% with three.
The 52.6% at three balls is the odd one, and it is almost entirely a single count. Take 3-0 out and the other two three-ball counts come in at 62.5% together, higher than any strike group or ball group on the board. A single count, thrown 23,995 times, pulls the whole three-ball row backward.
So the count is not one dial that turns toward swinging as it gets friendlier. It is two dials, and strikes is the one a hitter is actually turning.
With fewer than two strikes, getting further ahead makes a hitter more selective
With fewer than two strikes, a Division I hitter's swing rate climbs for a ball or two and then falls back. With no strikes it went 30.6% at 0-0, 37.5% at 1-0, 34.7% at 2-0, and 6.2% at 3-0. The one-strike row does the same thing: 42.1% at 0-1, 48.9% at 1-1, 52.5% at 2-1, then back down to 48.1% at 3-1. Only with two strikes does the line keep rising all the way out: 47.8% at 0-2, 56.9% at 1-2, 64.4% at 2-2, 70.7% at 3-2.
A hitter was more likely to swing at 1-0 (37.5%) than at 2-0 (34.7%), even though 2-0 is the better count by every measure anybody uses. In the three counts almost every hitting guide labels a hitter's count, Division I hitters swung at 34.7% of pitches at 2-0, 6.2% at 3-0, and 48.1% at 3-1. Two of those three sit below the league's own 43.6% average, and 3-0 is the lowest swing rate of all twelve counts.
The counts she actually attacked are the ones where she is in trouble. The three highest swing rates in 2026 Division I softball were 3-2 at 70.7%, 2-2 at 64.4%, and 1-2 at 56.9%. All three are two-strike counts. The whole country swings hardest when it has the least left to lose.
A called strike costs more at 0-2 than at 3-0, and hitters act like they know it
The swing rate follows the price of a called strike, not the hitter's confidence. A take at 2-0 costs a hitter 2-1, which is still a fine place to be. A take at 0-2 can cost her the at-bat on the spot.
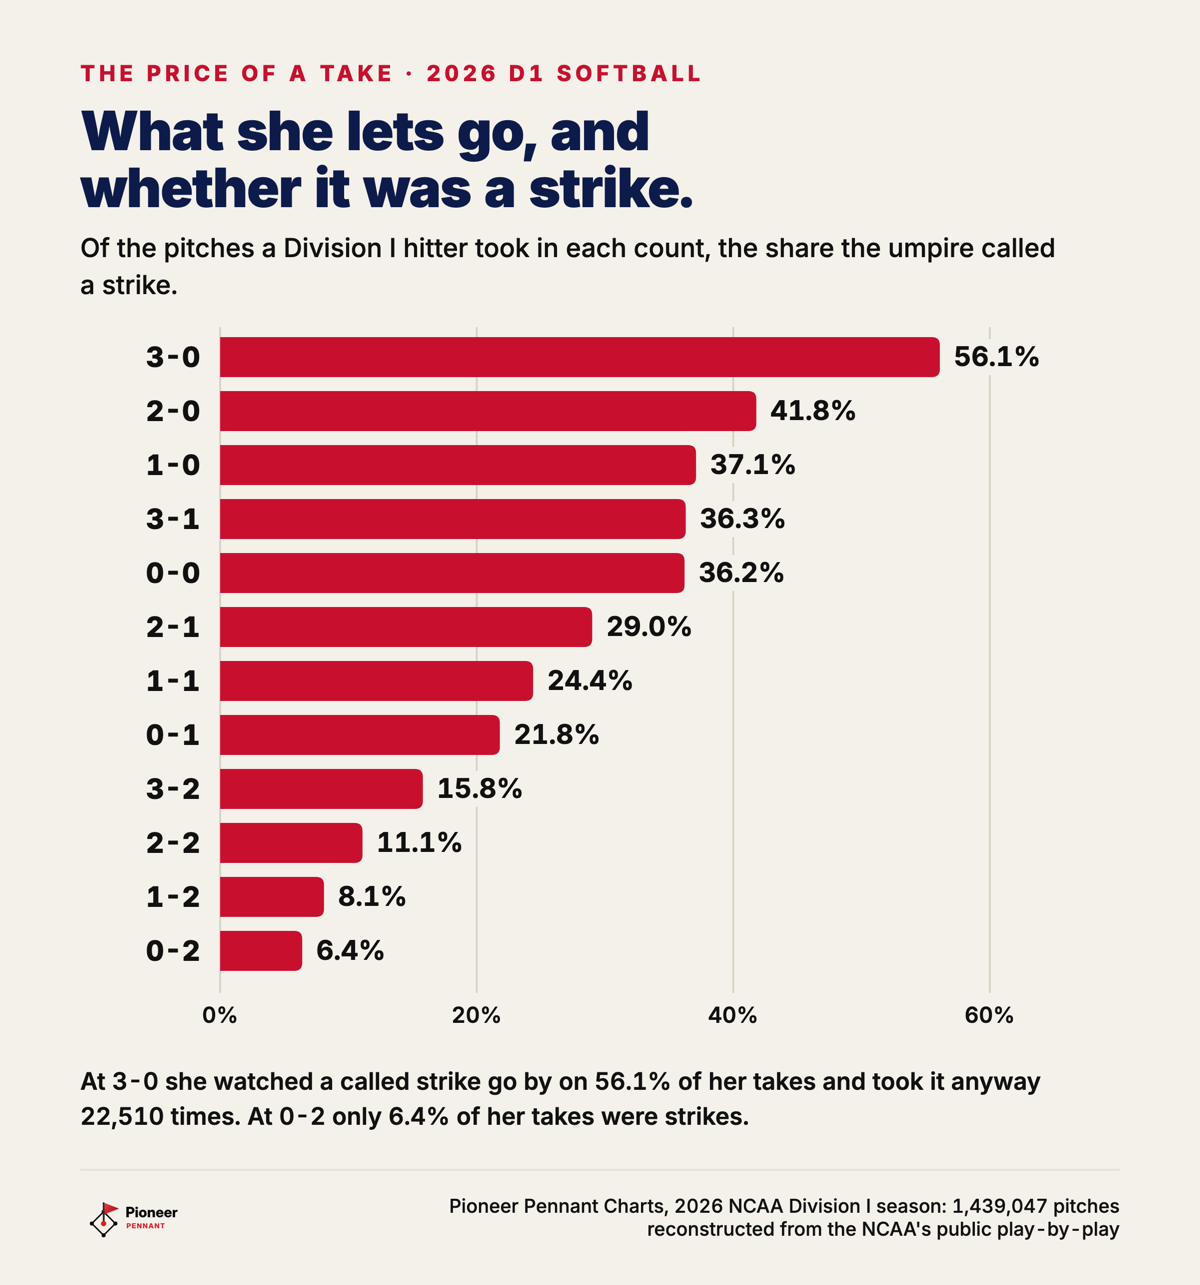
Watch what hitters let go and the pricing shows up cleanly. A called strike is a pitch she does not swing at that the umpire rules a strike. At 3-0, 56.1% of the pitches a Division I hitter took were called strikes, the highest share of any count, and she took them anyway on 22,510 of the 23,995 pitches she saw there. At 0-2, only 6.4% of her takes were called strikes. The same hitter who will stand and watch a strike go by at 3-0 will not let anything near the zone pass at 0-2.
She is not being brave at 3-0. She is being correct. Under NCAA Rule 1.1 a base on balls is "an award of first base granted by the plate umpire to the batter who, during their time at bat, receives any combination of four pitches or awards that are declared balls," so at 3-0 the prize is one pitch away and a called strike only moves her to 3-1, where hitters still hit.
A rule at the other end of the count does just as much work. NCAA Rule 11.3.3.4 charges a foul ball as a strike only "when the batter has fewer than two strikes," so a two-strike swing that is late, early, or just off usually costs nothing at all. That is most of why 3-2 is the most-swung count in the sport.
The bunt is the one two-strike swing that still costs an out. Under Rule 11.3.3.5, a bunt fouled off after the second strike is a strike and the batter is out, which is one more reason the sacrifice is the wrong bunt. Both foul-ball rules and the strike zone itself are in the 2026-27 NCAA Softball Rules Book, which defines the zone as "the area above home plate between the bottom of the batter's sternum and the top of their knees when they assume their natural batting stance."
What to tell your hitter about softball hitting counts
Give her a plan for 0-0 first, because it is the only pitch she is guaranteed to see. The 0-0 pitch was thrown 383,966 times in the 2026 Division I season, 2.4 times as often as the next most common count, and hitters swung at 30.6% of those pitches. Most cage sessions treat that pitch as a warmup and spend the bucket on two-strike emergencies, which is backwards given what one first pitch is worth.
Then give her a different plan for the back half. Pitches thrown with two strikes made up 369,485 of the season, 25.7% of everything thrown, so a quarter of what she sees arrives with the at-bat already on the line. Between those two ends her swing rate should move about 40 points, because the whole country's does.
"Be aggressive" is right in one count. "Work the count" is right in another. A hitter with one approach has the wrong one for most of the at-bat, and the fix is not a better swing. The fix is knowing which of the twelve boxes she is standing in.
Method: swing rate is swings divided by pitches seen in that count, where a swing is any offer at the pitch, including fouls and balls put in play. Counts are the balls and strikes before the pitch was thrown. Pitch sequences come from the NCAA's free public play-by-play for 6,351 of the 8,161 Division I games in the 2026 season, reconstructed and validated against official box scores. Every number in this post is re-checked by code against the dataset before the page builds, and the page refuses to publish if one disagrees.
Figuring out where your player fits in college?
Pioneer Pennant Process covers all 978 NCAA softball schools: coaches and how to reach them, cost after aid, majors, and a fit score built on one rule. Go where you are going to play, not as high as you can go.