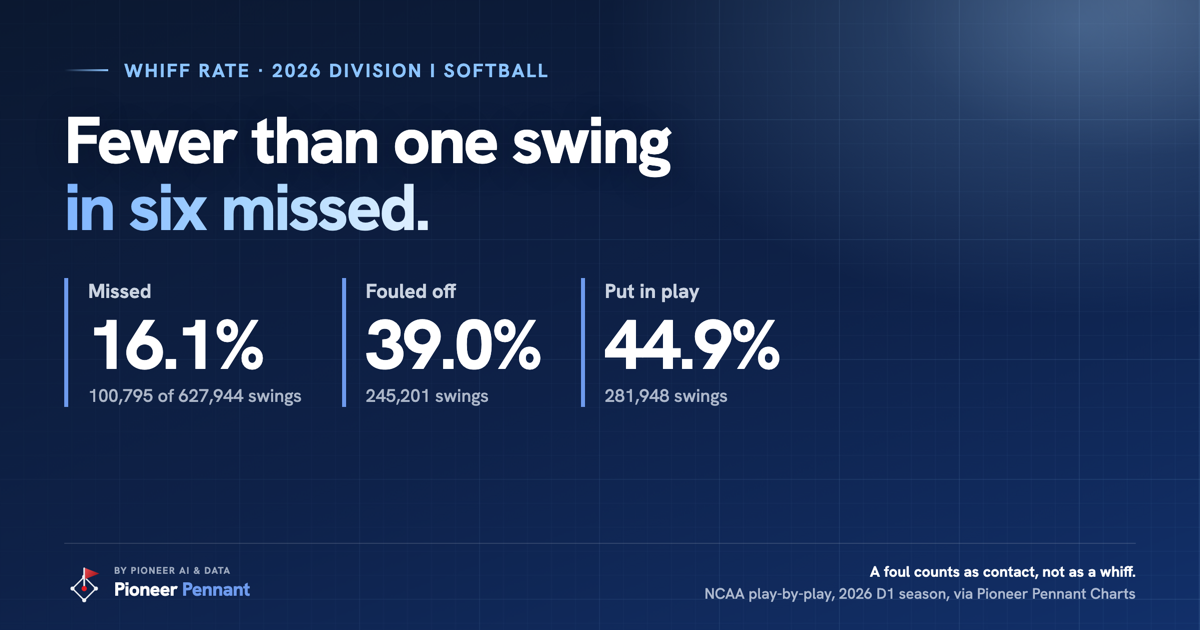
The softball whiff rate, the share of swings that miss the ball entirely, was 16.1% for Division I hitters in the 2026 season. A miss is one of three things that can happen on a swing, and the other two happened more often: Division I softball hitters fouled off 39.0% of their swings and put 44.9% in play. The counts come from the pitch-by-pitch record in the Pioneer Pennant Charts warehouse.
Division I softball hitters fouled off 39.0% of their 2026 swings and put 44.9% in play.
Whiff rate counts only the misses. A foul is a swing that made contact, and a called strike is not a swing at all, so neither one counts as a whiff. Every Division I softball team's season behind these numbers is on the Charts season hub.
The number usually lands in the bleacher argument about 43 feet. Forty-three feet is 71% of 60 feet 6 inches, so a 65 mph softball pitch reaches the plate in the same time as a 91 mph baseball pitch, counting from the pitcher's plate and leaving out the stride. The distance math is right, and a whiff rate does not overturn it.
Is it harder to hit a softball from 43 feet?
A count of misses cannot say whether softball is harder to hit than baseball, because Division I softball and Division I baseball are different games in ways a pitch-by-pitch count does not measure. A college softball is 11⅞ to 12¼ inches around and is released underhand with the hand below the hip, from a pitcher's plate 43 feet from home, under the 2026 and 2027 NCAA Softball Rules Book. A college baseball is 9 to 9½ inches around and is pitched from 60 feet 6 inches, under the current 2027 and 2028 NCAA Baseball Rules Book. The play-by-play records what happened on each pitch, not how fast it came in or how it moved.
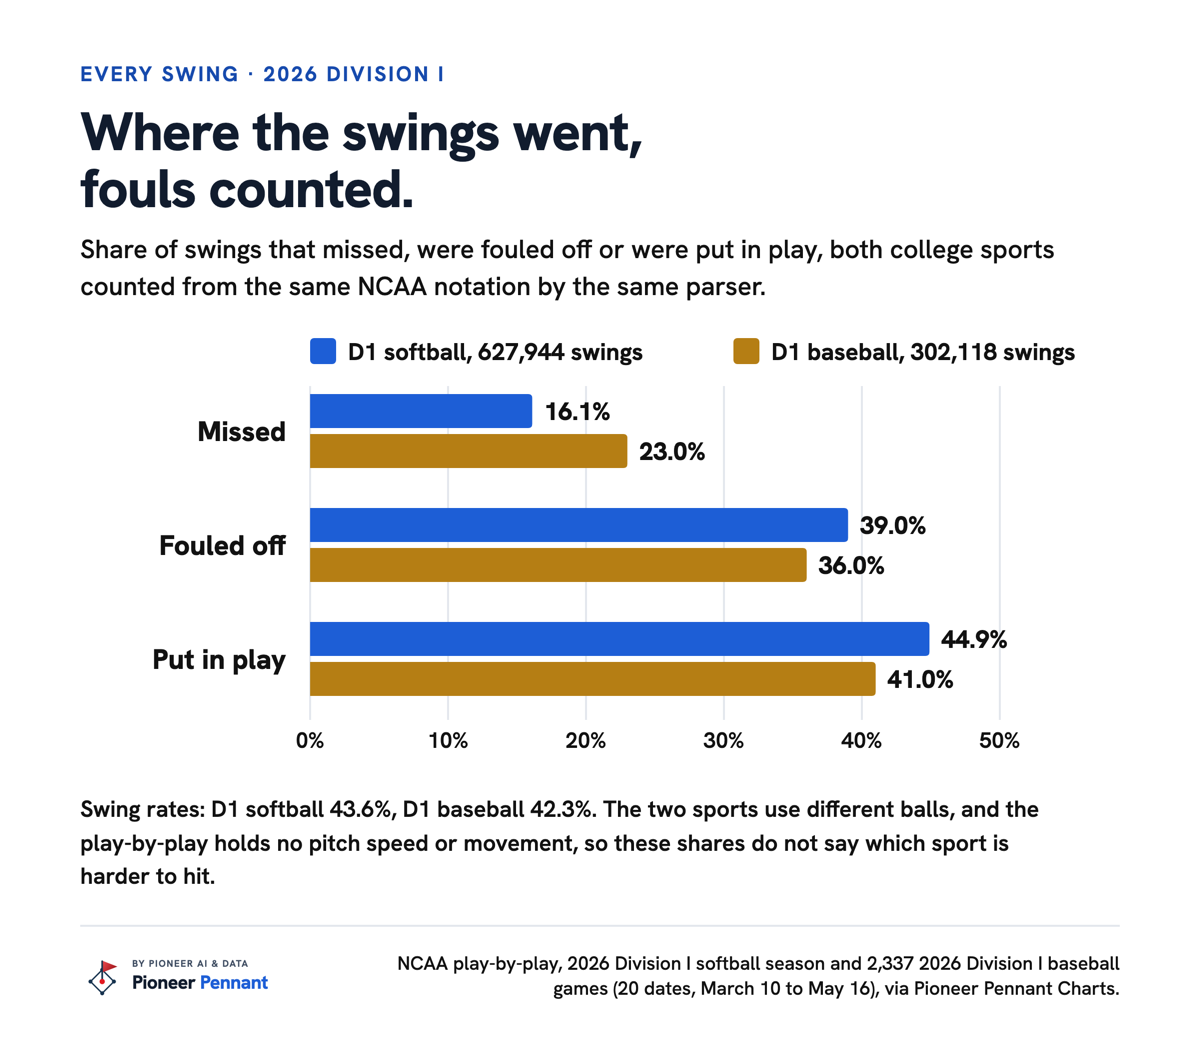
What the play-by-play can do is set the two sports side by side with every swing counted, fouls included. Both are scored in the same NCAA notation (B for a ball, K for a called strike, S for a swinging strike, F for a foul), and I ran both through the same parser.
| Share of swings, 2026 | D1 softball | D1 baseball |
|---|---|---|
| Missed | 16.1% | 23.0% |
| Fouled off | 39.0% | 36.0% |
| Put in play | 44.9% | 41.0% |
The softball column covers 627,944 swings across the 2026 Division I season, and the baseball column covers 302,118 swings in 2,337 Division I games on 20 dates of the same season. Matching the dates changes little: on the 19 of those 20 dates when Division I softball also played, softball hitters missed 15.2% of their swings, fouled off 39.1% and put 45.8% in play.
Hitters in both sports swung at about the same share of pitches: 43.6% of the 1,439,047 pitches in softball and 42.3% of the 714,981 pitches in baseball.
Counting the fouls narrows the difference between the two sports. Softball hitters missed less often, but they also fouled off more of their swings, so the gap in balls put in play (44.9% to 41.0%) is smaller than the gap in misses (16.1% to 23.0%).
Neither the gap in misses nor the gap in balls in play makes softball the easier game. A bigger ball thrown underhand from 43 feet and a smaller ball from 60 feet 6 inches are different problems for a hitter, and a count of what happened on each pitch cannot rank them.
Does contact mean a hit?
Contact is not a hit: fewer than half of Division I softball swings in 2026, 44.9%, put the ball in play, and a ball in play can still be caught. Of every five swings a Division I hitter took, about two were fouled off, a little more than two were put in play, and fewer than one missed.
The split matters for how a parent reads the whiff rate. Missing less is a real edge with two strikes, because a foul keeps the at-bat alive. A low whiff rate says nothing about how hard the ball was hit. For that, see where the ball goes once it is hit.
When does a Division I hitter miss most?
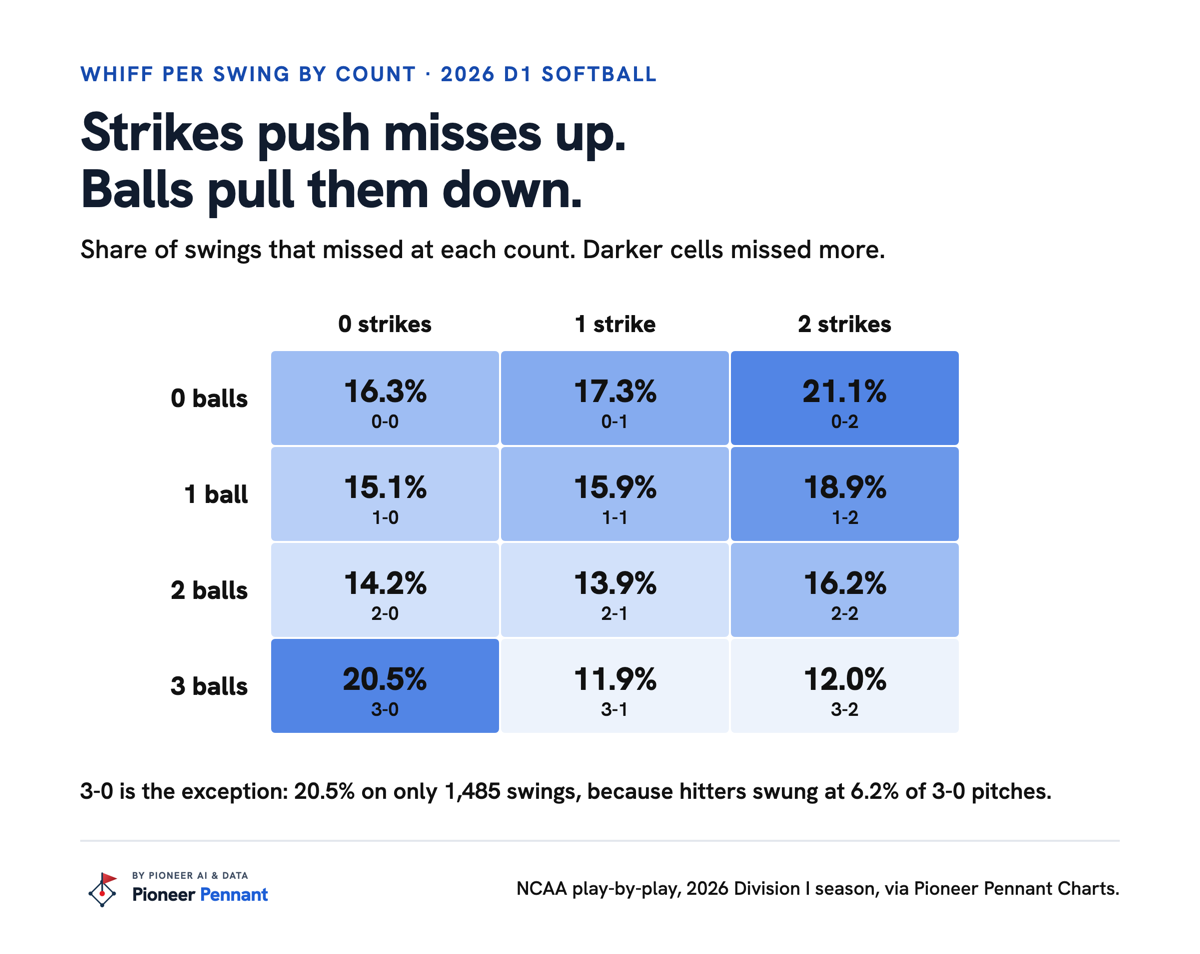
A Division I softball hitter missed most at 0-2, on 21.1% of her swings in 2026, and least at 3-1 and 3-2, on 11.9% and 12.0%. Strikes pushed the miss rate up, and balls pulled it back down.
Two strikes raised the miss rate at every ball count but three. With no balls, hitters missed 16.3% of their swings at 0-0 and 21.1% at 0-2. With one ball, they missed 15.1% at 1-0 and 18.9% at 1-2, and with two balls, 14.2% at 2-0 and 16.2% at 2-2.
With two strikes, more balls meant fewer misses: the miss rate fell from 21.1% at 0-2 to 18.9% at 1-2, 16.2% at 2-2 and 12.0% at 3-2. My read is that at 3-2 the pitcher has to come into the zone and the hitter knows it, while at 0-2 she is swinging at whatever the pitcher chooses to show her. The data shows the gap, not the reason.
One count breaks the pattern. At 3-0, hitters missed 20.5% of their swings, but that rests on only 1,485 swings (304 misses), because hitters swung at just 6.2% of 3-0 pitches. Treat it as a small sample. The full count-by-count swing picture is in the post on softball hitting counts.
How much does whiff rate vary between teams?
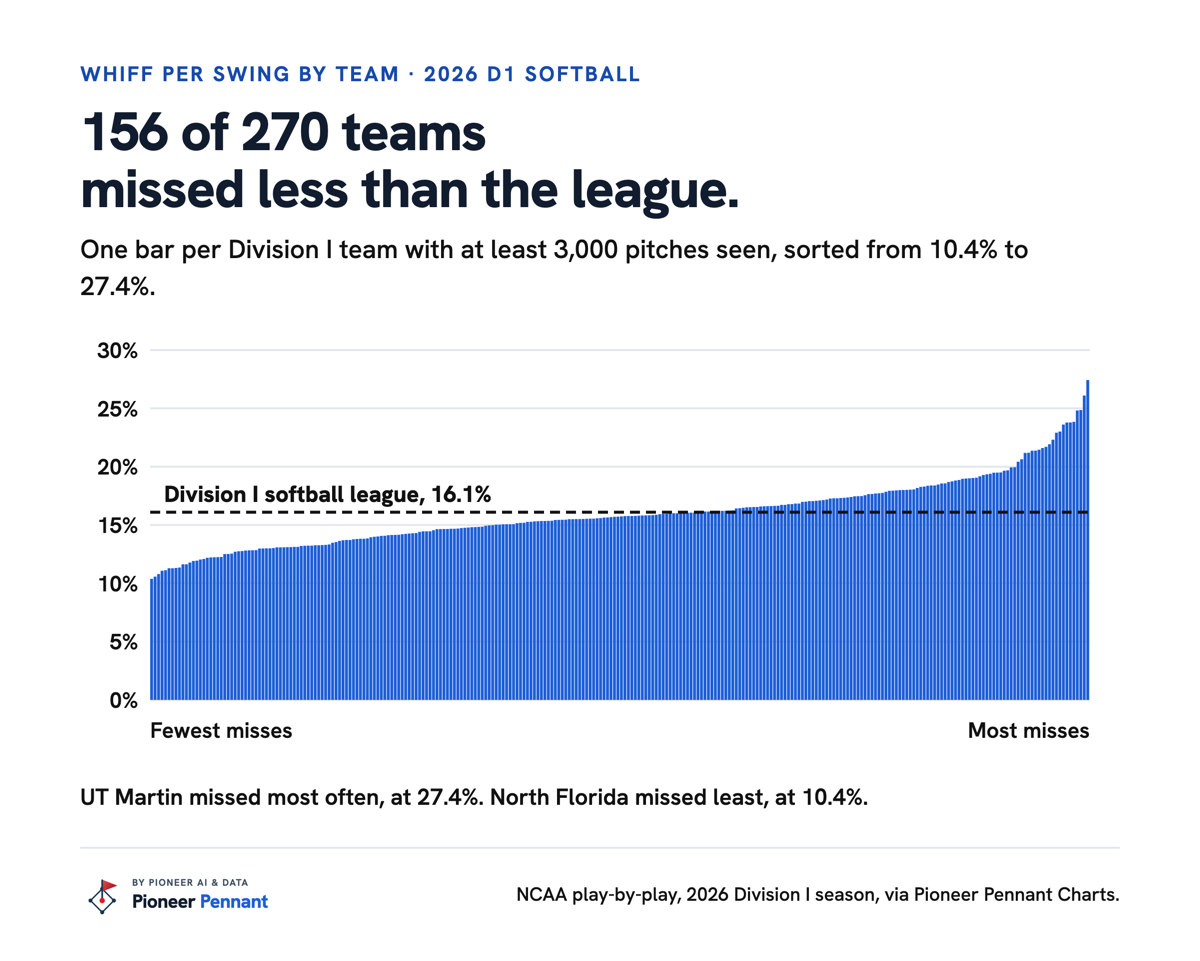
Across 270 Division I softball teams with at least 3,000 pitches seen in 2026, whiff rate per swing ran from 10.4% at North Florida to 27.4% at UT Martin. The league figure hides a wide spread.
Of those 270 teams, 156 missed less often than the league's 16.1%. Middle Tennessee had the second-highest whiff rate of the 270, at 26.1%, behind UT Martin.
A hitter who misses 25% of her swings is not broken, and a hitter at 10% is not automatically good. Whiff rate says how often she makes contact and nothing about what she does with it.
What to tell your hitter about whiff rate
Tell her that most Division I swings make contact, and the work is what she does with it. Division I softball hitters made contact on 83.9% of their swings in 2026, fouls included, so a hitter who misses one in four is well behind the field.
Then give her a reason to be patient when the count is going her way. In 2026, Division I hitters missed least at 3-1 and 3-2 and most at 0-2. My read is that waiting for a pitch she can hit pays off in contact as well as in walks.
If you track her stats, track whiff per swing next to her swing rate. The pair helps you tell whether a low miss rate came from skill or from swinging less. The swing side, count by count, is on the team pages in Charts.
Method: whiff rate per swing is swings and misses divided by swings, where a swing is any offer at the pitch, including fouls and balls put in play; the foul and in-play shares divide by the same swings, so the three add up to every swing. Softball numbers come from the NCAA's public play-by-play for 6,351 of the 8,161 Division I games on the 2026 schedule, reconstructed into pitches and validated against official box scores; the miss is the play-by-play's "swinging strike." Division I baseball numbers come from the same NCAA play-by-play notation, read by the same parser, for every regular-season game the source served on 20 dates, every Tuesday and Saturday from March 10 to May 16, 2026: 2,556 of the 2,567 final games on those dates, 2,337 of them with a recorded pitch sequence, pulled October 22, 2026. Earlier dates are left out because the source returned errors for most of their games. Team figures use teams with at least 3,000 pitches seen. The 65 mph and 91 mph pitches in the opening are an illustration of the distance math, not measured speeds. Every Pennant-computed number in this post was re-checked by code against the data before the page was built. The distances, the ball sizes, and the underhand rule are from the 2026 and 2027 NCAA Softball Rules Book (rules 2.27, 3.2.1 and 10.6.3) and the 2027 and 2028 NCAA Baseball Rules Book (rules 1-8 and 1-11), the current baseball edition, published in October 2026, after the season these counts cover; both books measure the distance from the nearer edge of the pitcher's plate to the back point of home plate.
Figuring out where your player fits in college?
Pioneer Pennant Process covers all 978 NCAA softball schools: coaches and how to reach them, cost after aid, majors, and a fit score built on one rule. Go where you are going to play, not as high as you can go.